Tree diagrams
Tree diagrams visually represent the sample space for experiments like flipping coins and rolling dice. Each branch signifies a new event, helping illustrate all possible outcomes. For instance, flipping three coins can yield outcomes like HHH or HHT. This document explores detailed examples, including drawing letters from a hat without replacement and calculating probabilities of different outcomes. Learn how to assign probabilities to each branch while keeping denominators consistent for accurate calculations.

Tree diagrams
E N D
Presentation Transcript
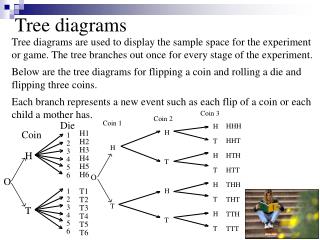
H H 1 T 2 H H3 3 H HTH H H4 4 T H5 5 HTT T H6 6 O O H THH T1 1 H 2 T2 T THT T 3 T3 T H TTH 4 T4 T 5 T5 T TTT 6 T6 Tree diagrams Tree diagrams are used to display the sample space for the experiment or game. The tree branches out once for every stage of the experiment. Below are the tree diagrams for flipping a coin and rolling a die and flipping three coins. Each branch represents a new event such as each flip of a coin or each child a mother has. Coin 3 Coin 2 Coin 1 Die HHH H1 Coin HHT H2
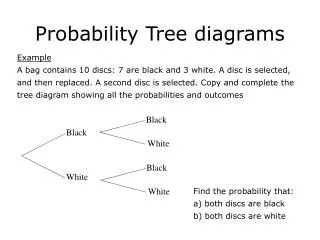
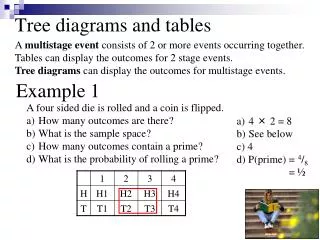
Example 1 2 D’s and 8 N’s are placed in a hat. 3 “letters” are drawn WITHOUT replacement. Draw a probability tree to show the outcomes. Probability tree diagrams With probability tree diagrams you place the probability of each event on each arm of the diagram. If there is no replacement in a question the probabilities on the arms change after each event. Note the probabilities on each set of arms adds to 1 DON’T simplify the probabilities. This means all answers will have the same denominators
R R B R B B Example 2 • A hat has 5 red disks and 3 black disks. • Two disks are drawn out without replacement. • What is the probability of drawing: • different coloured disks? • 2 red disks? a) P(different) = 15/56 + 15/56 = 30/56 = 15/28 Disk 2 Note the probabilities on each set of arms adds to 1 Disk 1 4/7 20/56 RR b) P(RR) = 20/56 = 5/14 5/8 3/7 15/56 RB 5/7 15/56 BR 3/8 DON’T simplify the probabilities. This means all answers will have the same denominators 2/7 6/56 BB 56/56 Check
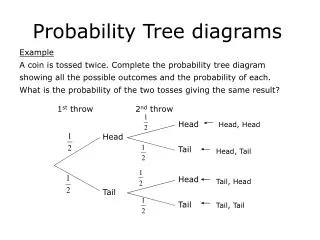
F F H F F H H F F H H F H H Example 3 • The probability of a Sydney resident catching the flu is 60%. • In a sample of 3 Sydney residents, what is the probability that; • exactly 2 residents have the flu? • at least one resident has the flu? The resident can be either have the flu (F, 3/5) or be healthy (H , 2/5). Resident3 As the population is so large, the probability does not change. Resident2 3/5 27/125 FFF 3/5 Resident 1 2/5 18/125 FFH a) P(2F, 1H) = 18/125 × 3 3/5 3/5 18/125 FHF = 54/125 2/5 2/5 12/125 FHH b) P(≥1F) = 1 − P(3H) 3/5 18/125 HFF 3/5 = 1 −8/125 = 117/125 2/5 12/125 HFH 2/5 3/5 12/125 HHF 2/5 2/5 8/125 HHH 125/125 Check
Today’s work Exercise 6-07 Page 219 → 220 1 → 4, 7, 9 → 11 & 14 Yesterday’s work Exercise 6-06 Page 214 → 216 Odds