Download
1 / 1
10 likes | 168 Vues
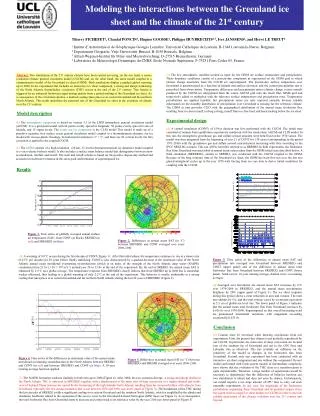
Modeling the interactions between the Greenland ice sheet and the climate of the 21 st century. Thierry FICHEFET 1 , Chantal PONCIN 1 , Hugues GOOSSE 1 , Philippe HUYBRECHTS 2,3 , Ives JANSSENS 2 , and Hervé LE TREUT 4

E N D
Modeling the interactions between the Greenland ice sheet and the climate of the 21st century Thierry FICHEFET1, Chantal PONCIN1, Hugues GOOSSE1, Philippe HUYBRECHTS2,3, Ives JANSSENS2, and Hervé LE TREUT4 1 Institut d’Astronomie et de Géophysique Georges Lemaître, Université Catholique de Louvain, B-1348 Louvain-la-Neuve, Belgium. 2 Departement Geografie, Vrije Universiteit Brussel, B-1050 Brussels, Belgium. 3 Alfred-Wegener-Institut für Polar- und Meeresforschung, D-27515 Bremerhaven, Germany. 4 Laboratoire de Météorologie Dynamique du CNRS, Ecole Normale Supérieure, F-75231 Paris Cedex 05, France. (3) The key atmospheric variables needed as input for the GISM are surface temperature and precipitation. These boundary conditions consist of a present-day component as represented on the GISM grid to which climate change anomalies from the CGCM are superimposed. The present-day surface temperature over Greenland is parameterized as a function of latitude and surface elevation, and the current precipitation rate is prescribed from observations. Temperature differences and precipitation ratios (climate change versus control) produced by the CGCM are interpolated from the coarse AGCM grid onto the much finer GISM grid and respectively added or multiplied with the reference surface temperatures and precipitation rates. Temperature perturbations are applied monthly, but precipitation ratios are only imposed annually because reliable information on the monthly distribution of precipitation over Greenland is missing for the reference climate. The GISM in turn provides CLIO with the geographical distribution of the annual mean freshwater flux resulting from ice sheet runoff, iceberg calving, runoff from ice-free land, and basal melting below the ice sheet. Abstract. Two simulations of the 21st century climate have been carried out using, on the one hand, a coarse resolution climate general circulation model (CGCM) and, on the other hand, the same model coupled to a comprehensive model of the Greenland ice sheet (GISM). Both simulations display a gradual global warming up to 2080. In the experiment that includes an interactive ice sheet component, a strong and abrupt weakening of the North Atlantic thermohaline circulation (THC) occurs at the end of the 21st century. This feature is triggered by an enhanced freshwater input arising mainly from a partial melting of the Greenland ice sheet. As a consequence of the circulation decline, a marked cooling takes place over eastern Greenland and the northern North Atlantic. This result underlines the potential role of the Greenland ice sheet in the evolution of climate over the 21st century. Model description Experimental design (1) The atmospheric component is based on version 5.3 of the LMD atmospheric general circulation model (AGCM). It is a grid point model with 64 points evenly spaced in longitude, 50 points evenly spaced in sine of latitude, and 15 sigma levels. The ocean–sea ice component is the CLIO model This model is made up of a primitive equation, free surface ocean general circulation model coupled to a thermodynamic-dynamic sea ice model with viscous-plastic rheology. Its horizontal resolution is 3° × 3°, and there are 20 vertical levels. No flux correction is applied to the coupled CGCM. (2) The GISM consists of a high-resolution (20 km, 31 levels) thermomechanical ice dynamics model coupled to a visco-elastic bedrock model. It also includes a surface mass balance model that distinguishes between snow accumulation, rainfall, and runoff. The melt and runoff scheme is based on the positive degree-day method and accounts for meltwater retention in the snow pack and formation of superimposed ice. (4) A control simulation (CONT) of 150-yr duration was first performed with the CGCM. The initial state consisted of outputs from equilibrium experiments conducted with the stand-alone AGCM and CLIO model. In this run, the atmospheric greenhouse gas and sulfate aerosol amounts were held fixed at the 1970 values. The model was then integrated from the beginning of year 21 of CONT for 130 years (corresponding to the period 1971-2100) with the greenhouse gas and sulfate aerosol concentrations increasing with time according to the IPCC SRES B2 scenario. This run will be hereafter referred to as SRESB2. In both experiments, the freshwater flux from Greenland was prescribed to annual mean values taken from the GISM initial state described below. A third simulation (SRESB2G), similar to SRESB2, was conducted with the CGCM coupled to the GISM. Because of the long response time of the Greenland ice sheet, the GISM has been first run over the last two glacial-interglacial cycles up to the year 1970 with forcing from ice core data to derive initial conditions for coupling with the CGCM. Results Figure 1. Time series of globally averaged annual surface air temperature (SAT) from CONT (in black), SRESB2 (in red), and SRESB2G (in blue). Figure 2.Differences in annual mean SAT (in °C) between SRESB2G and CONT averaged over years 2096-2100. (5) A warming of 0.8°C occurs during the first decade of CONT (Figure 1). After this initial phase, the temperature continues to rise at a slower rate (0.15°C per decade) for 50 years before finally stabilizing. CONT is also characterized by a gradual decrease in the maximum value of the North Atlantic annual mean meridional overturning streamfunction (which is an index of the strength of the North Atlantic deep water (NADW) circulation) from 21 Sv (1 Sv = 106 m3s-1) around year 20 to 13 Sv at the end of the experiment. By the end of SRESB2, the annual mean SAT is enhanced by 2.5°C on a global average. The temperature response from SRESB2G closely follows that from SRESB2 up to 2080 but is somewhat weaker afterward, thus leading to a global warming of only 2.2°C at the end of the experiment. This behavior is mostly attributable to a strong cooling that takes place over eastern Greenland and the northern North Atlantic during the last 20 years of SRESB2G (Figure 2). Figure 3.Time series of the differences in annual mean SAT and precipitation rate averaged over Greenland between SRESB2G and CONT (upper panel) and of the difference in annual mean total freshwater flux from Greenland between SRESB2G and CONT (lower panel). Solid curves: 10-year running average; dashed curve: no running average). (6) Averaged over Greenland, the annual mean SAT increases by 4°C over 1970-2080 in SRESB2G, and the annual mean precipitation heightens by 20% (upper panel of Figure 3). The ice sheet response during this period shows a clear reduction in area and volume. The total area shrinks by 1%, and the total volume varies by an amount equivalent to 5.5 cm of global sea level rise. The lower panel of Figure 3 indicates that the annual mean total freshwater flux from Greenland increases by 0.015 Sv over 1970-2080. Superimposed on this overall increasing trend are pronounced interannual variations, with magnitude exceeding occasionally 0.035 Sv. Conclusion (8) Caution must be exercised when drawing conclusions from our experiments. First, the present-day climate is not perfectly reproduced by our CGCM. In particular, the main sites of deep convection are located east of the southern tip of Greenland and not in the GIN Seas and Labrador Sea as observed. This has certainly an influence on the sensitivity of the model to changes in the freshwater flux from Greenland. Second, only one experiment has been conducted with an interactive ice sheet component and one without this component. Recent studies performed with Earth system models of intermediate complexityhave shown that the evolution of the THC close to a transition point is quite unpredictable. Therefore, a large number of experiments would be necessary to demonstrate that the difference of behavior between our two simulations is robust and does not arise by chance. Unfortunately, our model requires a too large amount of CPU time to carry out such ensemble experiments. In any case,the magnitude of the freshwater perturbation originating from Greenland and its potential impact stress the urgent need to couple ice sheet models to CGCMs in order to provide reliable projections of the climate evolution over the 21st century and beyond. Figure 4.Time series of the differences in maximum value of the annual mean meridional overturning streamfunction in the North Atlantic between SRESB2 and CONT (in red) and between SRESB2G and CONT (in blue). A 10-year running average has been applied. Figure 5. Differences in annual mean SAT (in °C) between SRESB2G and SRESB2 averaged over years 2096-2100. (7) The NADW formation weakens similarly in both runs up to 2080 (Figure 4). After 2080, the two scenarios diverge. A strong and abrupt decline in the North Atlantic THC is observed in SRESB2G together with a displacement of the main sites of deep convection to a region situated just south-west of Iceland. These features are caused by the freshening of the high latitude North Atlantic resulting from the increased inflow of freshwater from Greenland, especially the two strong anomalies that occur between 2070 and 2090 (see lower panel of Figure 3). The breakdown of the THC during the last decades of SREB2G yields a significant cooling over eastern Greenland and the northern North Atlantic, which is amplified by the albedo and insulation feedbacks related to the expansion of the sea ice cover in the Greenland-Iceland-Norwegian (GIN) Seas (see Figure 2). As a consequence, the total freshwater flux from Greenland starts to decrease and comes back to its reference value by the year 2100 (see lower panel of Figure 3).