Download
1 / 22
220 likes | 384 Vues
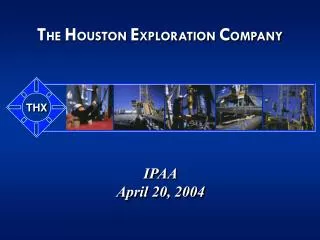
THX. T HE H OUSTON E XPLORATION C OMPANY. IPAA April 20, 2004. North American natural gas producer Founded in 1986; public in 1996; traded on NYSE Current market capitalization of + $1.3 billion Enterprise value of + $1.6 billion 2003 Highlights:

E N D
THX THE HOUSTON EXPLORATION COMPANY IPAAApril 20, 2004
North American natural gas producer Founded in 1986; public in 1996; traded on NYSE Current market capitalization of +$1.3 billion Enterprise value of +$1.6 billion 2003 Highlights: Proved reserves: 755 Bcfe (67% onshore, 33% offshore) Daily production: 295 MMcfe/d (93% natural gas) Net income: $131 MM ($4.20/sh) Closed two acquisitions: TEPI and EnerVest YE debt-to-cap: 29% Houston Exploration Profile
Business Strategy Focus on the Basics Focus on core areas with high operational controland working interest Replace 100+% of production through low-risk exploitation Manage volatility through hedging program Build Shareholder Value Maintain flexibility through fiscal responsibility and conservative debt levels Provide significant upside through offshore exploration Pursue selective acquisitions that provide attractive ROR
Growth with Financial Discipline Debt:Cap 62% 56% 38% 30% 30% 29%
Operating Areas Total 2003 Avg. Production: 295 MMcfe/d Arkoma: 23 MMcfe/d Proved Reserves: 111 Bcfe (15%) South Texas: 140 MMcfe/d Proved Reserves: 315 Bcfe (42%) Gulf of Mexico: 122 MMcfe/d Proved Reserves: 247 Bcfe (33%)
Balanced Portfolio High Offshore Deep Shelf Expl. Significant Upside Risk Rockies Predictable Upside Offshore Dev. Replace Production S. Texas Arkansas WV Low Production Impact
Capital Program 2003 Capex$460 MM* 2004E Capex$315 MM 5%Other 7%Other 36%Onshore 52%Onshore 59%Offshore 41%Offshore * Includes acquisition capexof $149 MM for TEPI& $28 MM for EnerVest
2004 Onshore Plans • South Texas • Continue 6 rig program • Add opportunities to maintain production and reserves • Arkoma • Implement 80-acre spacing • 2 to 3 rig program • Rockies • 1+ rig(s) all year, test 3+ basins and add reserves • Begin to “narrow” Rockies focus • Appalachia • Assimilate West Virginia acquisition • Drill 2 wells & make plans for undeveloped acreage
Onshore: Why We’re Here Onshore Basins Have 74% of Near-Term US Gas Potential THX THX Anadarko>15M’ LA GulfCoast TX Gulf Coast Appalachian Uinta/Piceance Anadarko <15M’ Powder River Permian <15M’ Green River San Juan Top 10 Producing Basins Source: PGC 2002 Data
South Texas Operations 2004 capex $113 MM Active rigs 6 Well cost $1.1 - $2.5 MM Reserves/well 1 – 2 Bcf Avg. well depth 8,000’ – 12,500’ Producing sands Wilcox/Lobo 3-D seismic 1,200 sq. miles 2003 Stats: Production 140 MMcfe/d Operated wells 476Net acres 65,000 THX Acreage 3DSeismic Area
Arkoma Basin Operations 2004 capex $23 MM Active rigs 2-3 Well cost $450 - $650 M Reserves/well .5 – 1.0 Bcf Avg. well depth 5,500’ Producing sand Atoka 2003 Stats: Production 23 MMcfe/d Operated wells 170Net acres 35,000
Rocky Mountain Operations Why the Rockies? • Large gas potential • Low F&D ($1/Mcfe or less) • Similar targets to otherTHX onshore operations • High level of managementexperience in area What we’ve done so far: • 200,000 acres in five states • 2004 capex of $20 MM • 12 wells planned for 2004 • Already success at Uinta Basin WillistonBasin Montana N. Dakota Big HornBasin WillistonBasin S. Dakota Wyoming GreenRiverBasin UintaBasin Utah
2004 Offshore Plans • Add reserves and production from the TEPI acquisition • Exploration and development opportunities • Exploit the potential of the deep-shelf prospects • Drill first THX operated deep-shelf test • Apply appropriate technology to reduce the riskand uncertainty for exploration • Develop new, operated, high-impact prospects • Participate in offshore lease sales
2004 Drilling Program YE03 Gulf PositionBlocks: 127 (69 Dev) THX Operated: 32 Platforms: 80 WC 77 MARG A 25% WI WC 77 25% WI WC 96 40% WI GA 191 67% WI EC 33 50% WI EC 160 72% WI BA 399 33% WI HI 262 50% WI ST 278 50% WI WC 269 2 Wells 100% WI EI 331 2 Wells 100% WI HI A283 3 Wells 70% WI 2004 Capex = $128 MM THX Lease TEPI Acquisition Lease Development Well Exploration Well
High Island A-283 2004 New Well Productionat HI A-283: 15 MMcf/d A-1 ST L-4 A-4 ST2 A-283 Proposed A-7 A-5 Proposed A-4 ST3 A-1 A-3 L-7A 1 Proposed A-3 ST THX A-1 ST A-2 Proposed A-6 B-1 L-9
THX’s Gulf of Mexico Potential Total Unrisked Potential 2,587 Bcfe
2003 Costs Are Competitive Full-Cycle Average $3.37 Source: Company reports
High Cash Margins Yield Profits $4.57 $4.32 $3.37 $2.40 Total Cash Costs
Hedged Production NYMEX Contract Price Avg. ($/MMBtu) Volume Effective Effective MMBtu/dFloorCeiling 1Q04 100,000 $4.70 none 2Q04 – 4Q04 100,000 $4.41 $6.91 Calendar ‘04 100,000 $3.75 $5.05 Calendar ‘04 40,000 $4.96 n/a Calendar ‘05 50,000 $4.77 n/a Calendar ‘05 150,000 $4.50 $5.69 Gas Hedges 2004 2005
Proven Growth Record Production Reserves 14% CAGR 13% CAGR
Geographically focused: 89% of reserves in 3 core areas Natural gas emphasis: 94% of reserves Strong track record of production and reserve growth Operational control: Operates 85% of properties / 75% avg. W.I. Low cost producer: $1.12/Mcfe cash costs in 2003 Drilling inventory: Current three-year prospect inventory Accomplished acquirer of assets Financial discipline / balance sheet strength The THX “Distinctions”
THE HOUSTON EXPLORATION COMPANY This presentation includes “forward looking statements” within the meaning of Section 27A of the Securities Act of 1933, as amended, and Section 21E of the Securities Exchange Act of 1934, as amended. Forward looking statements include estimates, plans, expectations, opinions, forecasts, projections, guidance or other statements that are not statements of fact, such as anticipated dates of first production, estimated reserves and projected drilling and development activity. Although the Company believes that the expectations reflected in such forward looking statements are reasonable, it can give no assurance that such expectations will prove to have been correct. There are many factors that could cause forward looking statements not to be correct, including the cautionary statements contained in this report and risks and uncertainties inherent in the Company’s business set forth in the filings of the Company with the Securities and Exchange Commission, including without limitation, the Company’s most recent Annual Report on Form 10-K. These risks include, among others, oil and gas price volatility, availability of services and supplies, operating hazards and mechanical failures, uncertainties in the estimates of proved reserves and in projections of future rates of production and timing of development expenditures, environmental risks, regulatory changes, general economic conditions, and the actions or inactions of third party operators. The Company does not undertake any obligation to update any forward looking statements contained in this report. The Securities and Exchange Commission has generally permitted oil and gas companies, in their filings with the SEC, to disclose only proved reserves that a company has demonstrated by actual production or conclusive formation tests to be economically and legally producible under existing economic and operating conditions. We use the term “exploration potential” or other descriptions of volumes of reserves potentially recoverable through additional drilling or recovery techniques that the SEC’s guidelines may prohibit us from including in filings with the SEC. These estimates are by their nature more speculative than estimates of proved reserves and accordingly are subject to substantially greater risk of being actually realized by the Company.