Process Design (Specification)
This class focuses on the four essential steps of problem solving: Orientation, Planning, Execution, and Testing. While these steps apply to various challenges, including programming and process design, we will specifically emphasize these contexts. We will explore visualization techniques such as flowcharts and Gantt charts to effectively communicate and design processes. By understanding how to apply specifications and utilize visual aids, participants will gain the skills necessary to tackle complex problems systematically and efficiently.

Process Design (Specification)
E N D
Presentation Transcript
Recall the Four Steps of Problem Solving* • Orient • Plan • Execute • Test These apply to any kind of problem, not just spreadsheet development, programming, or process design, but we will focus on those kinds of problems in this class * [Carlson and Bloom, “The Cyclic Nature of Problem Solving: An Emergent Multi-Dimensional Problem Solving Framework”, Educational Studies in Mathematics, Vol. 58 Number 1, 2005]
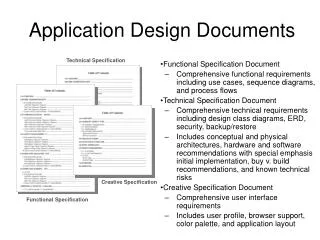
Specification • We’ve talked about doing the requirements (the orient phase… what we want to have happen) • Now we’re ready to talk about the specification or design phase (the planning phase… how it should happen) • Our tool for developing and communicating a design is the flow chart
Problem-Solving Techniques • Flowcharts are a visual technique for designing a process (figuring out how to do something) • Before we learn about flow charts (a technique for “how” problems), let’s look at a couple of useful visual techniques for solving other kinds of problems • For more on the ideas here, see Dan Roam’s website, www.digitalroam.com
“When” Problems • Suppose we want to make a master plan showing team leaders when each step of a complex process they are directing and coordinating will take place • When -> timeline • Since we need to convey a large amount of precise information, a Gantt Chart is an appropriate visual tool
How Many/How Much • Suppose we need to answer how many/how much • Bar charts are often used • Pie charts are another option (controversial because it is harder to compare pie slices than bars) • There are plenty of interesting and clever variations… such as the word usage chart (next slide)
Example: Seeing the Market These charts show how much versus when. They give much more insight than a numerical list of prices.
Flowcharts: “How” • Flowcharts are a visual tool for specifying a process • They can be as high level or as detailed as we need them to be • They use symbols and arrows to represent steps and choices
Flowchart Symbols Flowline: Connects symbols and indicates the flow of logic. It is a one way street. Input/Output: Data to be read or displayed are described inside. Terminal: Represents the beginning or end of a task. Processing: The process description is included inside the symbol. Decision: Used for logic/comparison operations. Has one entry and two exits.
One more… Continuation
Simple Processes • A simple process has no decisions in it; you always do it the same way • As a result, its flowchart is just a straight line of boxes connected by arrows • Example: most recipes, instruction sheets with assemble-it-yourself furniture, simple calculations
Simple Process: Compound Interest • Goal: Given a number N of years, an amount P of money (principal), and an annual interest rate R, calculate the total amount of money T you will have after P is invested for N years at rate R, using interest which is compounded annually. T = P(1+R)N • Test 1: P = 100, N = 1, R = 5% (.05): 105 • Test 2: P = 100, N = 7, R = .05: 140 • Test 3: P = 0, N = 7, R = .05: 0 • Test 4: P = 100, N = 7, R = 0: 100 • Test 5: P = 100, N = 0, R = .05: 100
Just for interest • P = 100, N = 20, R = .05 gives 265 • P = 100, N = 30, R = .05 gives 432 • By contrast, simple interest at 5 percent gives $5 per year, so after 20 years you have a total of $200; after 30 you have $250. • If R is, say, 8%, the difference is even more striking.
Storing Information • In this process we have to keep track of some information, like how much principal we have, what the interest rate is, etc. • We’ll use variables to store these values
Variables • A variable is a name used to refer to a quantity whose value can change • You can think of a variable as the name of a container that holds a value • (A constant is a name for a quantity whose value does not change.) • A spreadsheet cell is a good example of a container that can hold a value
Math Variables vs Programming/Spreadsheet Variables • In math, a variable is used in an equation to represent some single quantity. • If we are given the equation 3x = x + 6, we can solve this equation for x and get x = 3. You can check the correctness by substituting 3 for x on each side and seeing that you get the same value (9) • An “equation” like x = x + 1 would be meaningless; it has no solution
Programming Variables • Programming variables and spreadsheet locations are a place to store a value, which can change • The assignment statement x = 4 means to store the value 4 in location x. It is not really an equation, though it looks like one • The pair of assignments, x = 4 x = x + 1 means to first store a 4 in location x, and then take the current contents (4), add 1, and store the result (5) in location x. The order of the statements is extremely important.
Compound Interest Calculator begin R = annual rate N = number of years P = principal We used variables R, N, P, and T. T = P*(1+R)^N Arrows in a flowchart are like one-way streets; once you go down one, you can’t back up Output T end
Example Spreadsheet • The spreadsheet called Interest Calculator 1 has this formula in it • Let’s take a minute to see how to build this spreadsheet
Algorithm • The interest rate calculator is an example of a simple algorithm: a type of effective method in which a list of well-defined instructions for completing a task will, when given an initial state, proceed through a well-defined series of steps, eventually terminating in an end-state • Thought to be named for Al-Khwārizmī, Persian astronomer and mathematician
User Interface • The first step in the design is often to think about the user interface • What does the user interact with? • What are the possible events that can occur?
Candy Machine Objects and Events • Coin slot • User inserts a coin • Candy slot • Opens so a piece of candy can come out • Handle • The user attempts to turn the handle • Coin receptacle • It can be full or not full • These are all the objects in the requirements that have events • However: how does the machine know if there is a correct coin in the coin slot? Or any coin at all? It looks like the handle turning mechanism needs to be able to check some things.
Handle Functions • The turn of the handle tries to send a coin to the coin receptacle. The handle only allows the correct coins through and won’t turn otherwise • The handle should not turn if the coin receptacle is full • The designer is someone like a mechanical engineer who can figure out whether we can build a handle mechanism like this within our budget, and what the tradeoffs are • We won’t look at the mechanical aspect of this, but we can express the logical flow of the solution in a flow chart
Turning the Handle • The next slide shows the flowchart for the event where someone tries to turn the handle of the candy machine • It shows the use of the begin/end, conditional, and process step boxes
Handle Flowchart start begin attempt to turn handle no correct coin in slot? yes no yes receptacle has room? handle does not turn handle turns coin goes into receptacle candy slot opens end
From Use Cases to Flowchart • In the candy machine example, we have several objects, but only one event that requires a process: trying to turn the handle • The use cases were various complete scenarios of an interaction with the machine • We abstracted information from several use cases to design the handle turning event • We use the tests to make sure we put the pieces together correctly
Event-Driven Design • This type of design is called “event driven” because it works by analyzing what the events are in the process and what should happen as a result of each event • This has turned out to be a highly effective way of designing processes