PROCESS CAPABILITY
PROCESS CAPABILITY. BPT2423 – STATISTICAL PROCESS CONTROL. CHAPTER OUTLINE. Estimation of Population σ from Sample Data Control Limits versus Specification Limits The 6 σ Spread versus Specification Limits Calculating Process Capability Indices. LESSON OUTCOMES.

PROCESS CAPABILITY
E N D
Presentation Transcript
PROCESS CAPABILITY BPT2423 – STATISTICAL PROCESS CONTROL
CHAPTER OUTLINE • Estimation of Population σ from Sample Data • Control Limits versus Specification Limits • The 6σ Spread versus Specification Limits • Calculating Process Capability Indices
LESSON OUTCOMES • Understand the difference between specification limits and control limits • Learn to calculate and interpret the process capability indices: Cp, Cr and Cpk
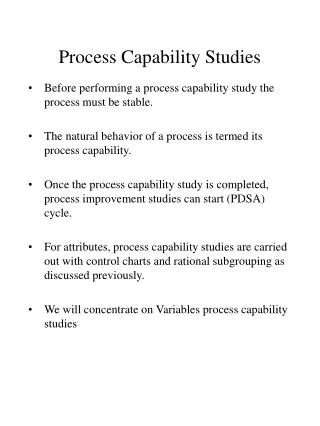
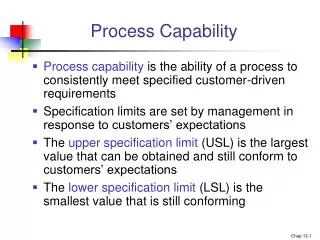
INTRODUCTION • Process capability refers to the ability of a process to produce products or provide services capable of meeting the specifications set by the customer or designer • Knowing the process capability gives insight into whether or not the process will be able to meet future demands place on it • Determining the process capability aids industry in meeting their customer demands – a customer may ask for part tolerances so fine that the machines are not capable of producing to that level of exactness • An undersized part A may not mate correctly with an oversized part B
ESTIMATION OF POPULATION σ • Sample values and their averages provide insight into the behavior of an entire population • ẋ becomes a more reliable estimate of µ as the sample size is increased • If the process can be assumed to be normal, the population standard deviation can be estimated from either the standard deviation associated with the sample standard deviation (s) or the range (R) :
CONTROL LIMIT vs SPEC. LIMIT • It is important to note that a process in statistical control will not necessarily meet specifications as established by the customer • There is a difference between a process conforming to specifications and a process performing within statistical control • Specifications communicate what the customers expect, want or need from the process – considered the voice of the customer • Control limits are the voice of the process – a prediction of the variation that the process will exhibit in the near future • Difference : specifications relay wishes and control limits tell of reality
THE 6σ SPREAD vs SPEC. LIMITS The spread of the individuals in a process, 6σ, is the measure used to compare the realities of production with the desires of the customers Case I : 6σ < USL - LSL This allows for more room for process shifts while staying within the specifications. Notice that even if the process drifts out of control, the change must be dramatic before the parts are considered out of specification.
THE 6σ SPREAD vs SPEC. LIMITS Case II : 6σ = USL - LSL A shift in the process mean or an increase in the variation present in the process will creates an out of specification situation Case III : 6σ > USL - LSL Process is incapable of meeting the specification set by the customer. To correct this problem, management intervention will be necessary. The capability of the process cannot be improved without changing the existing process
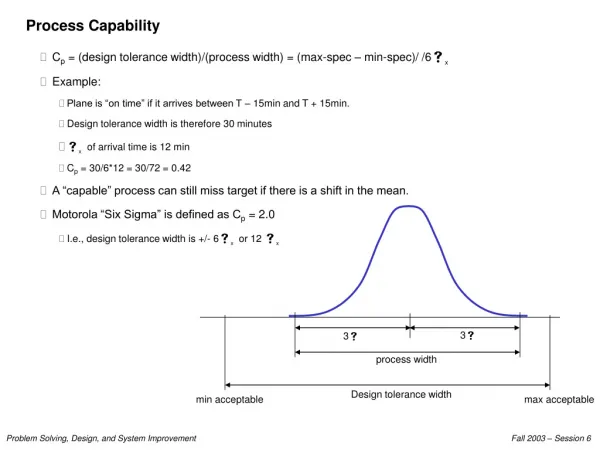
CAPABILITY INDICES Capability Index, Cp Cp > 1.00 : Case I situation exists. The greater this value, the better Cp = 1.00 : Case II situation exists. This is not optimal, but it is feasible Cp < 1.00 : Case III situation exists. Value of less than 1 are undesirable and reflect the process’s inability to meet the specification
CAPABILITY INDICES Capability Ratio, Cr Cr < 1.00 : Case I Cr = 1.00 : Case II Cr > 1.00 : Case III Centering of the Process, Cpk Where Z (min) is the smaller of :
Cpk = negative number Cpk = zero Cpk = between 0 and 1 Cpk = 1 Cpk > 1 MEANINGS OF Cpk MEASURES Note : Cpk is the ratio that reflects how the process is performing in relation to a nominal, center or target value.
RELATIONSHIP BETWEEN Cp AND Cpk • When Cp has a value of 1.0 or greater, the process is producing product capable of meeting specifications • The Cp value does not reflect process centering • When the process is centered Cp = Cpk • Cpk is always less than or equal to Cp • When Cp is greater than or equal to 1.0 and Cpk has a value of 1.00 or more, it indicates the process is producing product that conforms to specifications • When Cpk has a value less than 1.00, it indicates the process is producing product that does not conform to specifications • A Cp value of less than 1.00 indicates that the process is not capable • A Cpk value of zero indicates the process average is equal to one of the specification limits • A negative Cpk value indicates that the average is outside the specification limits
EXERCISE Hotels use statistical information and control charts to track their performance on a variety of indicators. Recently a hotel manager has been asked whether or not his team is capable of maintaining scores between 8 and 10 (on a scale of 1 to 10) for “overall cleanliness of room”. The most recent data has a mean of 8.624, a standard deviation of 1.446 and n = 10. calculate and interpret Cp and Cpk
REVISE THE CHARTS State of Process Control • A process is considered to be in a state of control or under control when the performance of the process falls within the statistically calculated control limits and exhibits only chance / common causes • When a process is under control, it is considered stable and the amount of future variation is predictable • Several benefits to a stable process: • There is a rational basis for planning • Quality levels are predictable • When improvements are made, the effects of the changes can be determined quickly and reliably
REVISE THE CHARTS Control Chart Interpretation • Correct interpretation of control charts is essential to managing a process • Understanding the sources and potential causes of variation is critical to good management decisions • Misinterpretation can lead to a variety of losses, including: • Blaming people for problems that they cannot control • Spending time and money looking for problems that do not exist • Spending time and money on process adjustments or new equipment that are not necessary • Taking action where no action is warranted
REVISE THE CHARTS • There are two circumstances under which the control chart is revised and new limits calculated • If a charts exhibits good control and any changes made to improve the process are permanent • When the new operating conditions become routine and no out-of-control signals have been seen • The revisions provide a better estimate of the population standard deviation – a better understanding of the entire process can be gained • Control limits are also revised if pattern exist – provided that the patterns have been identified and eliminated • The new limits will reflect the changes and improvements made to the process – used to judge the process behavior in the future
REVISE THE CHARTS Steps taken to revise the charts: • Interpret the original chart • Isolate the cause • Take corrective action • Revise the chart • It is necessary to remove any undesirable points or groups of points, the causes of which have been determined and corrected • If no cause can be found and corrected, then the pointscannotbe removed from the chart • The points removed will equal zero and the calculations will continue from there