Process Capability Confusion
Process Capability Confusion. by John J. Flaig, Ph.D., FASQ Applied Technology 1237 Clark Way San Jose, California, 95125, U.S.A. Tel: 408-266-5174 E-mail: JohnFlaig@Yahoo.com www.e -AT- USA.com Published in the Quality Digest Daily, 17 Jan 2013. Confusion.

Process Capability Confusion
E N D
Presentation Transcript
Process Capability Confusion by John J. Flaig, Ph.D., FASQ Applied Technology 1237 Clark Way San Jose, California, 95125, U.S.A. Tel: 408-266-5174 E-mail: JohnFlaig@Yahoo.com www.e-AT-USA.com Published in the Quality Digest Daily, 17 Jan 2013
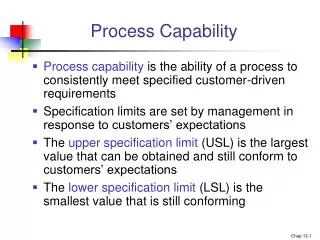
Confusion • You may have noticed that there is a huge amount of confusion with regards to the Process Capability Indices Cp’s, and Process Performance Indices Pp’s (see the iSixSimga website). Specifically when to use which one and what they mean. I would say that a large proportion engineering community have no idea which is the correct metric to use in a given situation or why.
Terminal Terminology • The difference rests on which estimator of variation is used, but the ramifications of the choice are significant. • The sigma estimate for Pp’s comes from what some people call the long-term variation. • The sigma estimator for the Cp’s comes from what some people call the short-term variation.
The Devil is in the Details • So I would like each of you to write down on a piece of paper your definition of short-term variation and how you would estimate it. You have two minutes. • OK, let’s see what you have come up with.
The Real Definition • For time series data short-term just means a small time window subset of the time series. • However, to develop an analytic measure of process capability requires a rational subgroup estimate of process variation.
Houston, we have a problem! • A rational subgroup means that the causes of variation within the subgroup are homogeneous (i.e., the 5M’s and 1E are essentially constant). • The definition of a short-term subgroup does not imply that it is a rational subgroup. • When people do not know what they need to have to solve a problem, they often have a hard time finding it.
ANOVA and SPC Don’t Mix • Now for the process capability confusion, statisticians break down the components of variation in terms of the sum of squares as follows: • SSW + SSB = SST • SSwithin + SSbetween = SStotal, in other words • STV + LTV = TV • Short-Term Variation + Long-Term Variation = Total Variation
What to do? • Now do you see the problem? • The Pp’s are based on Total Variation, but it is called long-term or LT variation in the process capability literature (i.e., sLT = stot/c4,N)[Bothe, 2001, p. 91]. No wonder people are confused. • I recommend dropping short-term and long-term and going with the correct terminology. • For Pp’s sTOT = stot/c4,N , for Cp’s sRSG = srsg/c4,n
A Compounding of Errors • This mistake was caused by engineers not naming things in a way that was consistent with the foundational science of statistics. • However, not to be outdone by the misguided engineers the statistician’s have doubled down on the problem because when they began developing metrics they apparently forgot about the difference between an analytic study and an enumerative one.
What Else Could Go Wrong? • Thus, they used total variation estimators in many of their proposed metrics, which they then named incorrectly as Cp’s when they are really Pp’s.
In Summary • So the difference between Cp’s and Pp’s is that Cp’s are analytic metrics and can be used to predict future performance of the process within statistically determined limits. Pp’s on the other hand are enumerative metrics that can tell you how your process performed in the past but offer no clue about future performance.
We are Not out of the forest yet! • So what makes you think metrics like Cp, Cpk and Cpm are really so great? • We really should ask ourselves, “What is process capability and how can it be measured?”
Different Views • What process capability means is perceived and expressed by different people in different ways. For example; • The Operations view • The fraction nonconforming because of rework and scrap costs • The Engineering view • The deviation from the target or specification limits do to concern about the affect on product performance
Different Views (cont.) • The Quality view • The cost of quality (i.e., appraisal, prevention, internal failure cost, and external failure cost) • The Management view • The affect that process performance has on profits do to its impact on revenue and costs
Statistics and Damn Lies • Now with so many difference contending views it is easy to see why people are confused about how to assess process capability (and I have left out the statisticians view so as to not confuse you even more).
Reality Check • The easiest way to think about process capability is in terms of its relationship to a process control chart. So suppose we have a bunch of data taken in chronological order from a process. We need to check to see if the measurement tool has adequate resolution, that the data are independent, and that the process is stable. You need all these things before you can even hope to understand process capability.
More Requirements • In addition to that long list we need to add in process distribution location, shape, spread, target, and specification limits. • And for the usual PCI’s like Cp, Cpk, and Cpm the distribution must be approximately normal.
Saved by Software? • Well things are getting a bit complicated so let’s just fall back on the plug and crank approach by letting the software do the thinking for us. • JMP computes Cp, Cpk and Cpm using the long-term variation estimate. They should call these Pp’s not Cp’s. I will to talk to them. • Minitab computes both long-term and short-term metrics, but is their short-term estimate really from a rational subgroup?
The Process Capability Goal • Correct variation estimates from the control chart. • Capability metrics should address both cases of process Target and Midpoint of the spec, where T = M and T ≠ M. • Basic PCI’s: Pp, Ppk, Ppk(LO), Ppm, and Cp, Cpk, Cpk(LO), Cpm The LO values are the 95% lower confidence limits. • Percent nonconforming in each tail and total • Confidence interval values for nonconformance • Sigma Quality Level
The Process Capability Goal • Capability metrics for non-normal distributions • Empirical, Cpc, Cnpk • Net Sensitivity (i.e., a robustness measure) • Dual Economic Metrics Expected Loss [E(L), SD(L)] Expected Profit [E(GP), SD(GP)]
References • Bothe, D. R. (2001), Measuring Process Capability, Landmark Publishing, Inc., Cedarburg, WI. • Flaig J. J., (2009), A Unifying Process Capability Metric, Journal of Industrial Engineering and Management, Vol. 2, No. 1, 2009 • Flaig J. J., (2006), Selecting Optimal Specification Limits,Quality Technology and Quantitative Management, Vol. 3, No. 2, 2006 • Flaig J. J., (2002), Process Capability Optimization, Quality Engineering, Marcel Dekker, Vol. 15, No. 2, 2002
References • Flaig J. J., (1999), Process Capability Sensitivity Analysis, Quality Engineering, Marcel Dekker, Vol. 11, No. 4, 1999 • Flaig J. J., (2012), Process Capability Analysis Using Curve Fitting Methods, Global Journal of Researches in Engineering, Vol. 13, No. 1, Ver. 1.0 • Flaig J. J., (1996), A New Approach to Process Capability Analysis, Quality Engineering, Marcel Dekker, Vol. 9, No. 2, 1996 • Flaig J. J., (1993), Expectation Pareto Charts and Optimal Resource Allocation, Quality Engineering, Marcel Dekker, Vol. 5, No. 3, 1993