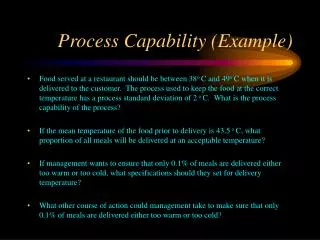
Process Capability
Explore the concept of process capability in Lean Six Sigma, from estimation formulas to interpreting indices, ensuring products meet customer specifications efficiently.

Process Capability
E N D
Presentation Transcript
Process Capability Chapter 19
Process Capability • She had the virtuous sense of one who has made an intuitive leap from the most fragile collection of evidence. • Lean Six Sigma practitioners know that they can not make quick judgments without the data to support their conclusions. They need evidence. They need the answer to the question: How do we know the process will generate products or services that meet the customer’s specifications?
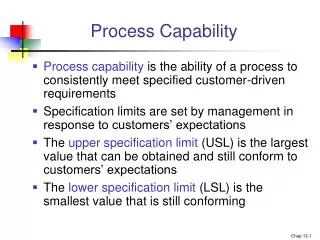
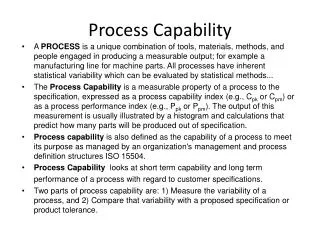
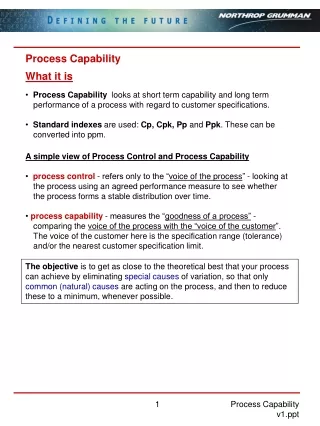
Process Capability • Process capability refers to the ability of a process to produce products or provide services capable of meeting the specifications set by the customer or designer.
Process Capability • The relationship between the population standard deviation and the standard deviation of the subgroup averages is shown by the formula:
Process Capability • The population standard deviation can be estimated from either the standard deviation associated with the sample standard deviation (s) or the range (R):
Process Capability • CONTROL LIMITS VERSUS SPECIFICATION LIMITS • Specifications communicate what the customers expect, want, or need from the process. Specifications can be considered the voice of the customer. • Control limits are the voice of the process. The centerline on the X-bar chart represents process centering. The R and s chart limits represent the amount of variation present in the process. Control limits are a prediction of the variation that the process will exhibit in the near future.
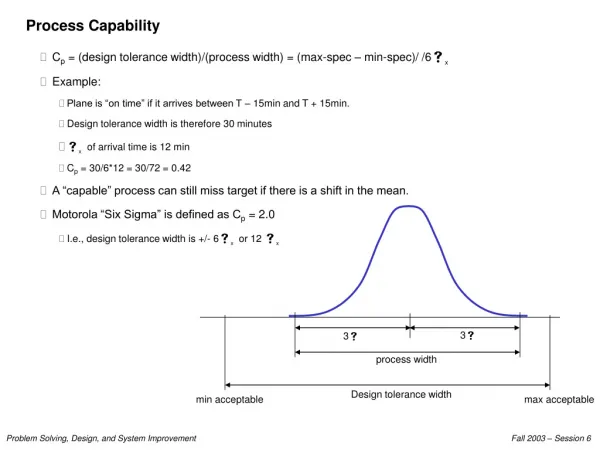
Process Capability Case I • The 6 spread of the process individuals is shown by the solid line. As expected, the spread of the individual values is greater than the spread of the averages; however, the values are still within the specification limits. The 6 spread of the individuals is less than the spread of the specifications. This allows for more room for process shifts while staying within the specifications. Notice that even if the process drifts out of control, the change must be dramatic before the parts are considered out of specification.
Process Capability Case II • In this situation, 6 is equal to the tolerance. As long as the process remains in control and centered, with no change in process variation, the parts produced will be within specification. However, a shift in the process mean will result in the production of parts that are out of specification. An increase in the variation present in the process also creates an out-of-specification situation.
Process Capability Case III • Any time that the 6 spread is greater than the tolerance spread, an undesirable situation exists. Even though the process is exhibiting only natural patterns of variation, it is incapable of meeting the specifications set by the customer.
Process Capability • Calculating Process Capability Indices • Capability Index cp
Process Capability • Calculating Process Capability Indices • Capability Ratio Cr
Process Capability • Calculating Process Capability Indices • Cpk
Process Capability INTERPRETING PROCESS CAPABILITY INDICES • When Cp has a value of 1.0 or greater, the process is producing product capable of meeting specifications. • The Cp value does not reflect process centering. • When the process is centered, Cp = Cpk • Cpk s always less than or equal to Cp • When Cpis greater than or equal to 1.0 and Cpk has a value of 1.00 or more, it indicates the process is producing product that conforms to specifications. • When Cpk has a value less than 1.00, it indicates the process is producing product that does not conform to specifications. • A Cp value of less than 1.00 indicates that the process is not capable. • A Cpk value of zero indicates the process average is equal to one of the specification limits. • A negative Cpk value indicates that the average is outside the specification limits.