Download
1 / 38
380 likes | 512 Vues
POPULATION CHANGE IN NEW BRUNSWICK. Barry Edmonston Population Resource Group University of Victoria. IMMIGRATION FLOWS. About 250,000 annual immigrants to Canada Most settle in three large metropolitan areas Rapidity, size, and concentration of the in-flow

E N D
POPULATION CHANGE IN NEW BRUNSWICK Barry Edmonston Population Resource Group University of Victoria
IMMIGRATION FLOWS • About 250,000 annual immigrants to Canada • Most settle in three large metropolitan areas • Rapidity, size, and concentration of the in-flow • Relatively few immigrants in other places, especially smaller towns and rural areas • Nevertheless, immigrants can have large effects for smaller populations and there are recent program to encourage settlement in new destinations
INTERPROVINCIAL MIGRATION • Interprovincial migration is large: about 500,000 people migrate annually, and more than 2 million persons change their province of residence over a five-year period • For Atlantic provinces, these flows are usually larger than international migration • In recent years, large flows into Alberta, British Columbia, and Ontario
REPERCUSSIONS OF LOW FERTILITY • Because of low childbearing levels, migration has become the major demographic force affecting local population growth • Communities and provinces will experience population decreases in the absence of counterbalancing in-migration • Understandable that municipalities and provinces are interested in programs to reduce out-migration and to promote in-migration
TODAY’S PRESENTATION • Components of population change in New Brunswick • Alternative population futures for New Brunswick • Recent migration flows in New Brunswick • New immigrant destinations in Canada
UNPEELING THE POPULATION ONION • What factors affect population change in New Brunswick? • Let’s examine births, death, international migration, and interprovincial migration trends for the past fifteen years • After looking at annual components of change, let’s look at the relative effects on long-term population growth
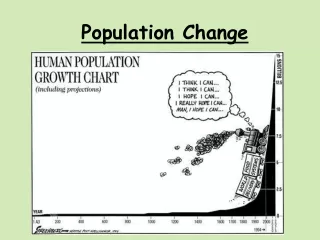
ALTERNATIVE FUTURES FOR NEW BRUNSWICK’S POPULATION • It is hard to see the future when we are in the midst of a changing population • Current New Brunswick population is greatly affected by current age structure and the age distribution of migrants arriving and leaving • A useful model is to, first, imagine what New Brunswick’s population would be with replacement-level fertility and no net migration
BASIC COMPONENTS OF POPULATION CHANGE FOR NEW BRUNSWICK, 2005 • Population is 752,000 and slowly decreasing • Births=6,880 (with TFR=1.4 children) • Deaths=6,561 • So, annual natural increase is +300, but will decrease steadily in future years and staying negative as long as below replacement-level fertility prevails
MIGRATION COMPONENTS FOR NEW BRUNSWICK, 2005 • Immigrants=1,330 • Emigrants=-300 • So, net immigration is 1,030 • In-migrants from other provinces=10,950 • Out-migrants to other provinces=12,600 • So, net interprovincial migration is -1,650 • And, overall net migration is -650
COMPARISON OF CURRENT CHANGES FOR LONG-TERM POPULATION FUTURE • If there were replacement-level fertility (about 10,200 births instead of current 6,900), New Brunswick’s population would stabilize at 702,000, or about 50,000 few people than in 2005 • How much does current fertility and current migration affect this long-term population level of 702,000?
CONTRIBUTION OF BIRTHS AND MIGRATION TO LONG-TERM POPULATION LEVEL OF 702,000 • Current births: -9,100 • International Migration, Immigration: +2,100 • Emigration: -300 • Domestic Migration, In-Migration: +15,100 • Out-Migration: -17,800 • Overall effect of Migration: -900 • This tells us that long-term population is declining by -10,000 (-9,100 and -900) each year current birth and migration levels continue
DEMOGRAPHIC OPTIONS ARE LIMITED • In the context of current demographic changes, the basic options are narrow: increase births by 48% to 10,200 per year or increase in-migration by 60% to about 20,000 per year • The current changes and options have important effects on New Brunswick’s future age distribution as well • Can fertility or migration be affected (practically, effectively, at low cost)?
WHO COMES: IMMIGRANT NUMBERS • In recent years, the annual number of immigrant arrivals in the Atlantic Provinces has varied between 2,800 and 5,000 • The largest share of immigrants have settled in Nova Scotia • In order to compare provinces, it is useful to calculate the number of immigrant arrivals relative to population size
MIGRATION IN THE ATLANTIC PROVINCES • Trends for 1996 to 2001 for: (i) Canada-born residents (ii) resident immigrants who were in Canada in 1996 and (iii) immigrant arrivals who arrived in Canada between 1996 and 2001 • We look at five groups: (i) children and youth (ii) post-secondary students (iii) non-working adults (iv) working adults and (v) retirees
NATIVITY OF MIGRANTS • Useful to examine three groups • Canada-born residents who move interprovincially • Resident immigrants who were in Canada five years ago and move interprovincially • Immigrants arrivals during the past five years and who make their initial provincial settlement (they might move later, of course)
MIGRANT TYPES • Migrants move for different reasons, with many moving primarily for employment. • Consider five types: • Children less than 18 years • Post-secondary students, 18 to 25 years and attending school full-time • Non-working adults, 18 to 64 years and not working • Working adults, 18+ years and working • Retirees, 65+ years and not working
BROADER CONTEXT FOR MIGRATION • Immigrants constitute almost one-fifth of the Canadian populationbut are less common in small towns and rural areas • There has been a continued out-migration of younger adults from smaller towns and rural areasacross Canada • Provinces with more people in smaller towns and rural areas are more likely to experience out-migration
THEORIES ABOUT WHERE MIGRANTS SETTLE • Urbanization is worldwide: a defining aspect of migration is that it is often from rural to urban areas • Many factors influence choice of settlement destinations, including economic, social, and cultural factors • Two types of settlement processes: persistence of established locations and emergence of new locations for migrants
PERSISTENCE OF ESTABLISHED LOCATIONS • Over time, migrants develop social networks that provide relationships for movement • Migrants from a particular ethnic background develop ethnic-based resources • Local communities respond to migrant flows in ways that assist the continued arrival of newcomers • Once migration is established, continued migration usually persists for established migrant groups
NEW LOCATIONS FOR MIGRANTS • New locations challenge the persistence perspective…why do they arise? • New or unusually rapid employment growth • New employment sectors that recruit workers • Centralization of employment, such as meatpacking, in areas with limited workers • Sponsorship or deliberate recruitment of newcomers
IMMIGRANT SETTLEMENT AND RESETTLEMENT • Migration is closely tied to local economic growth and employment opportunities • Whether economic development or population growth comes first is a debatable point • However, a community’s success in generating employment growth will ultimately determine the effect on migration – for both Canada-born and immigrants
IMMIGRATION TO SMALL TOWNS • 7 communities have strong employment growth; some in only one industry • Remaining 3 communities have diversified, growing employment • Manitoba nominee program is important • Several of the communities have immigrant recruitment programs and work hard to attract newcomers
CONCLUDING COMMENTS • Low fertilility in New Brunswick poses population challenges for next decade • Immigrant arrivals in small towns suggests that new destinations for immigrants can be developed • Employment, community programs, and provincial immigration selection policies can create new immigration destinations • Chicken or the egg: jobs and migrants