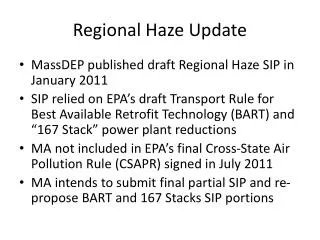
Download
1 / 27
270 likes | 290 Vues
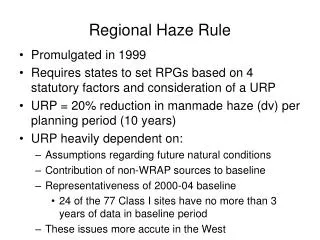
This progress report discusses the efforts and strategies of the California Environmental Protection Agency Air Resources Board in addressing regional haze and protecting Class 1 areas, such as Redwood National Park and Yosemite National Park. The report examines pollutant drivers, control measures, and goals for reducing haze by 2018.

E N D
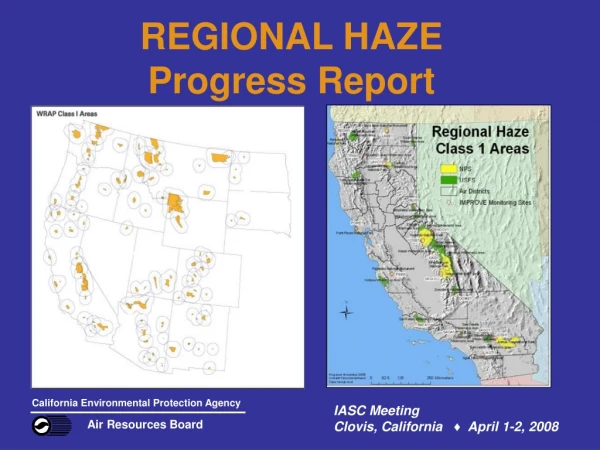
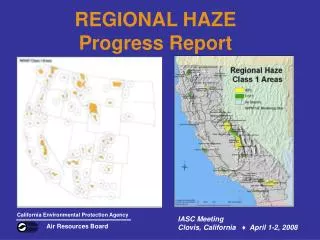
California Environmental Protection Agency Air Resources Board REGIONAL HAZEProgress Report IASC Meeting Clovis, California ♦ April 1-2, 2008
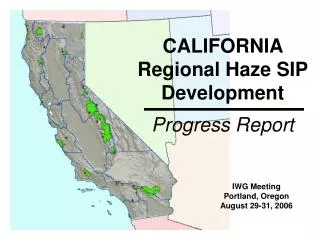
CALIFORNIA CLASS 1 AREAS 1. Redwood National Park 2. Marble Mountain Wilderness 3. Lava Beds National Monument 4. South Warner Wilderness 5. Thousand Lakes Wilderness 6. Lassen Volcanic National Park 7. Caribou Wilderness 8. Yolla Bolly Middle Eel Wilderness 9. Point Reyes National Seashore 10. Ventana Wilderness 11. Pinnacles National Monument 12. Desolation Wilderness 13. Mokelumne Wilderness 14. Emigrant Wilderness 15. Hoover Wilderness 16. Yosemite National Park 17. Ansel Adams Wilderness 18. Kaiser Wilderness 19. John Muir Wilderness 20. Kings Canyon National Park 21. Sequoia National Park 22. Dome Land Wilderness 23. San Rafael Wilderness 24. San Gabriel Wilderness 25. Cucamonga Wilderness 26. San Gorgonio Wilderness 27. San Jacinto Wilderness 28. Joshua Tree National Park 29. Agua Tibia Notes: The 17 IMPROVE monitors provide pollutant concentration measurements in or near California’s 29 Class 1 areas, so some data is the same for more than one Class 1 area in California. There are 156 Class 1 Areas in the United States.
OVERVIEW • RH SIP Requirements and Progress • What Pollutants Drive Haze in California • Ability to Control Sources of Pollutant Species • California Strategy for Initial Planning Period • California and National Issues Statewide Average Contribution to Light Extinction on Worst Haze Days
RH SIP sets Reasonable Progress Goals for 2018 RH SIP sets Reasonable Progress Goals for 2018 RH SIP sets Reasonable Progress Goals for 2018 Worst Day Baseline Worst Day Baseline Worst Day Baseline Uniform Glide Path Uniform Glide Path Uniform Glide Path Deciviews Deciviews Worst Days Average for Natural Conditions Best Day Baseline Conditions (must not be degraded) Best Day Baseline Conditions Best Day Baseline Conditions 2064 2064 2064 2018 2004 BASIC REQUIREMENTS • Calculate Best and Worst Days in Deciviews • Determine 2018 Reasonable Progress Goals in Deciviews • “Long Term Strategy” for reaching 2018 RPGs • BART Requirement (Best Available Retrofit Technology) • Consultation with Other States / Federal Land Managers • Public Webcast Workshop scheduled June 10, 2008 • Submission to U.S. EPA after Public Hearing (July 2008) • Mid-Course Reviews and SIP Updates every 10 years
MONITOR DATA & DECIVIEWS • Species Mass Light Extinction Deciview Value • Haze Algorithm II calculates light extinction • Deciview is the natural logarithm of light extinction • As Haze Species concentration increases, Light Extinction increases, Visibility worsens, Deciview number increases • Reduce Haze Species, Deciview number decreases, clearer air with higher range of visibility • Bottom line: reduce haze species “drivers” of worst day haze • Determine drivers at each IMPROVE monitor (Class 1 Area) and figure out where sources are • Model to look back at emissions and look forward to 2018
Haze Algorithm Tutorial: Measuring Visibility • Haze pollutants are particles that have the ability to absorb and reflect light radiation; both actions extinguish light and decrease visibility. Particle mass, humidity, and temperature influence the amount of light extinction caused by haze species. Rayleigh scattering is affected by elevation and temperature. • The “HAZE ALGORITHM” uses Species Mass to determineLight Extinction which is converted to a Deciview Value. • Every third day, 24-hour mass measurements are made of all the haze species collected at each IMPROVE monitor and the Haze Algorithm is used to deliver individual species and total species Light Extinction in inverse megameters (Mm-1). • The Haze Algorithm for calculating Light Extinction (bext) weights the Species Mass (ug/m3) measured at the IMPROVE monitors using particle size, humidity, and elevation as follows: bSulfate = 2.2 x fS(RH) x [small SO4] + 4.8 x fL(RH) x [large SO4] bNitrate = 2.4 x fS(RH) x [small NO3] + 5.1 x fL(RH) x [large NO3] bOrganic Material Carbon = 2.8 x [Small OM] + 6.1 x [Large OM] bElemental Carbon = 10 x [EC] bFine Soil = 1 x [Fine Soil] bSea Salt = 1.7 x fSS(RH) [Sea salt] bCoarse Mass = 0.6 x [CM] bRayleigh = (Site Specific factor, related to elevation, ranging from 7+ to 11+ in California) bNitric Oxide gas= 0.33 x [NO2 (ppb)] (not measured at most IMPROVE sites.) The sum of the weighted extinction values gives the total daily extinction (Total bext) for each day of measurement: Total bext = bSulfate + bNitrate + bEC +bOMC + bSoil + bCM + bSS + bRay + bNO2 • The deciview scale was created to describe the total light extinction capability of all haze species in the ambient air at a given time at a given location. The Deciview Value (dv) is the natural logarithm of the total calculated light extinction on each day of measurement. Mass measurements for all species must be available to calculate the dv for a given day. Deciview Value (dv) = 10 ln (Total bext / 10) • Each year, the daily Deciview Values are ranked for the entire year and the 20% highest days are averaged to obtain the “Worst Day” deciview average for that year. The average Worst Day Deciview Value for each of the baseline years are then averaged to get the Baseline “Worst Day” Deciview Value for the monitor. The same process is undertaken to calculate the 20% “Best Day” deciview average using the lowest ranking days (cleanest, best visibility) for the baseline. • These “Worst Day” and “Best Day” average Deciview levels are used to develop the Long-Term Strategy and Reasonable Progress Goals for the Regional Haze SIP.
California C1A Out-of-State C1A IMPROVE monitor GEOGRAPHIC OVERVIEW • Far Northern California (Inland) • organics, sulfates, nitrates • Sierra Nevada Mountains • organics, sulfates, nitrates • Coastal Sub-Units • -sea salt, sulfate, nitrate, organics • Southern California • nitrates, organics, sulfates • Closest Neighbor Class 1 Areas • Arizona (Grand Canyon…) • Oregon (Kalmiopsis…) • Nevada (only Jarbridge)
NORTHERN CALIFORNIA • TOTAL light extinction ~ 10 times higher on Worst Days • Organic Carbon (OC) clearly drives Worst Days • Wildfires, Transportation Corridors, Stationary Sources
SIERRA CALIFORNIA • TOTAL light extinction ~ 6-12 x higher on Worst Days • Organic Carbon or Nitrates drive worst days • Wildfires and Biogenics (OC), Urban Mix (nitrates/sulfates) • Coarse Mass and Fine Soil from wind events • Monitor Elevation (exposure to inversions, long-range transport)
SOUTHERN CALIFORNIA • TOTAL light extinction ~ 6-12 x higher on Worst Days • Nitrates drive worst days; sulfates and organics also have roles • Mobile sources (on and off-road) key component year-round • Coarse Mass and Fine Soil from natural events • Monitor Elevation (exposure to inversions, long-range transport)
COASTAL CALIFORNIA • TOTAL light extinction ~ 4-7 x higher on Worst Days • Sea Salt and Sulfates more influence than elsewhere • Affected by marine commercial shipping • Onshore – Offshore wind patterns; different source attribution for same haze species
EMISSIONS AND SOURCES • California Statewide inventory of haze precursors (WRAP 2002c in Tons per Year) • Organic Carbon sources primarily natural • Nitrate sources primarily anthropogenic • Does not include marine commercial vessel emissions
TRANSPORT OTHER INFLUENCES California RH SIP focuses on anthropogenic sources under state or local control * Numbers are rounded estimates of haze pollutant source origin based on source attribution modeling
new NAAQS standards… urban/wildland interface pressures… population growth and climate change… STRATEGY FOR 2018 California “Long-Term” Strategy for Initial Planning Period • On-the-Books Ozone/PM Controls Modeled to give Reasonable Progress Goals for 2018 • BART Reductions minimal due to existing controls • Adjust at Mid-Course Review with more data and new post-2004 controls
PRELIMINARY REASONABLE PROGRESS Baseline Modeling Results: Visibility improves at all California Class 1 Areas
MID-COURSE REVIEW • Future Program Benefits from NAAQS, SAAQS, Climate Change, Goods Movement, Diesel Risk Reduction Programs • Same pollutants involved • Same high-emitting source categories (refineries, power plants, cement plants, large boilers) • Scheduled for 2012-2013 Time Frame • Emissions Reductions compared to Monitoring Data • Natural Conditions Assessment • May Adjust Reasonable Progress Goals
PENDING CONCERNS NASA Photo October 2007 • RH SIP as Learning Experience • BART reductions await final modeling • Regional cooperation essential • Continued consultation valuable • Controllable vs. Uncontrollable Sources • Wildfires, Dust Storms, and other Natural Events • Pacific Shipping / Oceanic Atmospheric Chemistry • Jet Stream Sources • International Transport (Mexico, Canada, Asia) • Organic Aerosols: Biogenic Emissions v. Anthropogenic VOCs • Achieving Natural Conditions • Will EPA continue to Fund Monitoring & Technical Support? • Will metrics change for calculating Natural Conditions or visibility? • Will it take until the 23rd Century?
Umpqua Complex Fire Plume REDW TRIN OREGON Biscuit Fire Plume PORE CALIFORNIA “SEEING” WILDFIRE PLUMES Analyzing Monitoring Data for “Natural Conditions” analysis: Canoe and Honey Fires not “seen” by Redwood but measurable at Point Reyes and Trinity Alps monitors Inventory and Modeling for “Baseline” Period: 2002 “Base Year” was very bad year for western wildfire emissions
“MEASURING” SMOKE IMPACTS • Need local knowledge and satellite photos • No IMPROVE monitors for John Muir Wilderness in 1994 • Neither YOSE > 150 miles NW, nor SEQU >50 miles SW saw OC change Exact same location: Scenic view picture taken at 3:00 PM on 9/21/1994 John Muir Wilderness Webcam Big Creek Fire 13 miles SW 8/15 - 8/29/1994picture taken at 3:00 PM on 8/27/1994
Southern California Fires – October 2003 October 25, 2003 From NASA/Goddard Space Flight Center Scientific Visualization Studio: http://svs.gsfc.nasa.gov/vis/a000000/a002800/a002842/ Photo of California wildfires from space, after the winds shifted toward Arizona and Nevada on October 29, 2003. Photo credit: NASA
northern el. 1469 m Sierra el. 1615 m SR SGA CU SGO JT SJ coastal el. 953 m AG REGIONAL “DUST” EVENTS “Tax Day” Asian Windfall: April 16, 2001 Santa Ana Winds: Autumn and early winter Sundowners & Valley transport? southern el. 507 m NASA image: February 9, 2002
Prepared by U.S. Census Bureau One dot = 7500 people FOR ADDITIONAL INFORMATION CARB Contacts: Tina Suarez-Murias csuarezm@arb.ca.gov Sylvia Zulawnick szulawni@arb.ca.gov Websites for Regional Haze: ARB –www.arb.ca.gov/planning/reghaze/reghaze.htm WRAP – www.wrapair.org TSS – http://vista.cira.colostate.edu/tss/
Monitoring Data converted to Light Extinction showing Best & Worst Days for 2000-2004 Basellne Period Millenium Fireworks Annual Worst Days – Light Extinction Worst Days Monthly Average - 2002 YOSE (Yosemite):Yosemite National ParkEmigrant Wilderness PRELIMINARY DRAFT 4-1-08
YOSE at Turtleback Dome, 1 mile west of Tunnel View PRELIMINARY DRAFT 4-1-08 YOSE (Yosemite):Yosemite National ParkEmigrant Wilderness
Organic Carbon Nitrates Sulfates 9-28-82 10-9-82 YOSE (Yosemite):Yosemite National ParkEmigrant Wilderness 2018 “On-the-Books Scenario Modeling: Source regions PRELIMINARY DRAFT 4-1-08