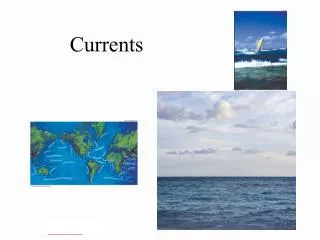
Analyzing Channel Currents Along Lake Superior Shoreline in Marquette, MI
Explore the study findings on wind events affecting currents near Marquette's beaches, analyze data trends, and suggest future research directions.


Analyzing Channel Currents Along Lake Superior Shoreline in Marquette, MI
E N D
Presentation Transcript
Analyzing Channel Currents Near the Lake Superior Shoreline in Marquette, MI Presented By: Keith Cooley National Weather Service-Marquette
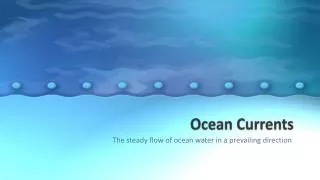
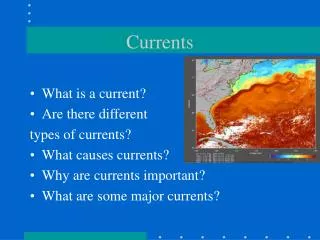
Overview • Background-channel currents, issues and outreach activities • Area of concern and terrain features • Observation Platforms • Study setup/Methodology/Data • Acoustical Doppler Current Meter • Conclusions/Results • Future work
Background • Picnic Rocks-Popular beach destination in eastern Marquette, MI • 15 total since 1963 • 7 drownings since 1996 • Age range-low 20s to upper 40s • Days varied (Not specific to holidays)
Outreach Activities • Marquette Water Safety and Recreation Expo • YMCA, NMU, Sea Grant and Marquette Water Safety Task Force • Signs and pamphlets
Site Location KNMU MCGM4
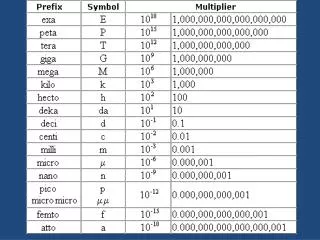
Acoustical Doppler Current Meter • Measures the shift in frequency to measure velocity • Measures velocity at five different layers • Each level is 3 feet deep…except the top layer
Methodology • Data collection • Binning system for wind direction • Two criteria analyzed • Compared wind direction with faster channel current speed • Compared wind speed and direction with faster channel current speed • Normalized to percent of wind direction
Wind Events Causing Faster Channel Currents Based on Direction in Layer 5 Both Sites
Percent of Wind Events Causing Faster Channel Currents Based on Direction in Layer 5 Both Sites
Wind Events Causing Faster Channel Currents Based on Direction in Layer 4 Both Sites
Percent of Wind Events Causing Faster Channel Currents Based on Direction in Layer 4 Both Sites
Wind Events Causing Faster Channel Currents Based on Direction in Layer 3 Both Sites
Percent of Wind Events Causing Faster Channel Currents Based on Direction in Layer 3 Both Sites
Review of Data… • Layers 4 and 5 show that North, South, and Northwest winds correlated best with faster currents • North and South events consistently maintained greater totals of events through the top three layers • Layer 3 maintained very few faster current events overall with only North and South events occurring more frequently • The bottom two layers (Layer 2 and 1) had very few events that were greater than 0.5 ft/s
When Normalized to Percentages… • North and South winds had greatest percentages ranging from 13 to 22 percent in layer 5 • North, Northwest, West and South maintained the highest percentages in layer 4 ranging from 14 to 30 percent • Westerly component possibly due to lag time during frontal passage • Most were below 1 percent in layer 3 and below
Events That Create Faster Channel Currents with Less Than 10 Knot Wind Speeds
Percent of Events for Each Direction in Layer 5That Created Faster Currents with Less Than 10 Knot Wind Speeds
Percent of Events for Each Direction in Layer 4That Created Faster Currents with Less Than 10 Knot Wind Speeds
Percent of Events for Each Direction in Layer 3That Created Faster Currents with Less Than 10 Knot Wind Speeds
Conclusions • More events occurred with winds from the north and south directions through each layer • Possibly give notice of elevated risks when winds are out of the north or south • Southwest, West and Northwest winds also have higher chances of producing faster channel currents • Very few increased current events were identified in Layer 3 and below • Most events occurred with winds less than 10 knots…except for south wind events which had equal chances of producing faster currents for both lower and higher wind speeds…similar to studies by Haines and Bryson (1961)
Conclusions • Possibly look into adjusting the location of the current meter due to low speed measurements
Future Work • Analyze lag time between increase/decrease in winds or change in direction compared to the increase/decrease in current flow • Look at surface weather patterns to determine if there is a relation of specific setups with stronger currents • Determine the effect of wave height and direction on the strength of the channel current • Collect more data for analysis and continue outreach activities
References • Donald, A. H. and R. A. Bryson, 1961, “An empirical study of wind factor in Lake Mendota”, Limnology and Oceanography, Vol. 6, No. 3, pp. 356 – 364.
Questions or Comments? Email: keith.cooley@noaa.gov