Complexometric Titrations (1)
Complexometric Titrations (1). 213 PHC 9 th lecture (1) Gary D. Christian, Analytical Chemistry, 6 th edition. Metal – EDTA Chelate. By the end of the lecture the student should be able to : Explain the different stages of comlexometric reactions titration curves .

Complexometric Titrations (1)
E N D
Presentation Transcript
Complexometric Titrations(1) 213 PHC 9th lecture (1) Gary D. Christian, Analytical Chemistry, 6th edition.
By the end of the lecture the student should be able to: • Explain the different stages of comlexometric reactions titration curves. • Select a suitable indicator to detect the end point.
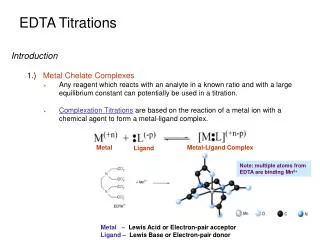
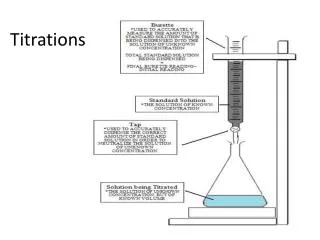
EDTA Titration Curves: A titration is performed by adding the chelating agent to the sample. e.g. titration of Ca2+ with EDTA Ca2+ + H4Y CaY2-
Before the eq. point, the Ca2+ conc. Is nearly equal to the unchelated Ca2+ . • At the eq. point and beyond, pCa is determined from the dissociation of the chelate at the given pH. • The more stable the chelate (Kf large), the farther to the right will be the equilibrium of the reaction, and the larger will be the end point break.
The highly stable chelates can be titrated at low pH values. This is important because it allows the titration of some metals in the presence of others whose EDTA chelates are too weak to titrate at the lower pH.
This figure shows the minimum pH at which different metals can be titrated with EDTA:
Detection of the end point: Indicators Indicators used are themselves chelating agent.
Eriochrome Black T: • It contains 3 ionizable protons. • Used for the titration of Mg2+ with EDTA. • It forms a red complex with part of the Mg2+. • The color of the uncomplexed indicator is blue. • As soon as all the free Mg2+ is titrated, the EDTA displaces the indicator from the magnesium, causing a change in the color. MgIn- + H2Y2-→MgY2- + In- + 2H+ redcolorlesscolorlessblue
The metal-indicator complex must be less stable than the metal-EDTA complex, or the EDTA will not displace it from the metal. Also, it must not be too weak or the EDTA will start replacing it at the beginning of the titration. The metal-indicator complex should be 10 to 100 times less stable than the metal-titrant complex.
Summary: • Complexometric titration curves. • Types of indicators used.