Titrations
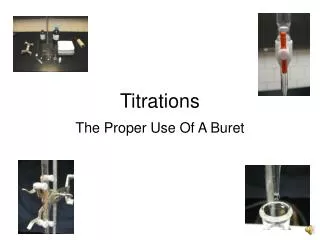
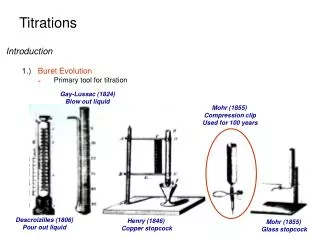
Titrations. Introduction 1.) Buret Evolution Primary tool for titration. Gay-Lussac (1824) Blow out liquid. Mohr (1855) Compression clip Used for 100 years. Descroizilles (1806) Pour out liquid. Henry (1846) Copper stopcock. Mohr (1855) Glass stopcock. Titrations. Introduction

Titrations
E N D
Presentation Transcript
Titrations • Introduction • 1.)Buret Evolution • Primary tool for titration Gay-Lussac (1824) Blow out liquid Mohr (1855) Compression clip Used for 100 years Descroizilles (1806) Pour out liquid Henry (1846) Copper stopcock Mohr (1855) Glass stopcock
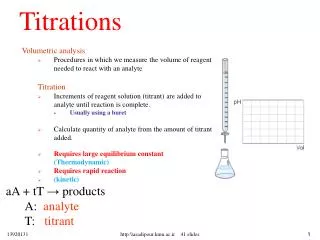
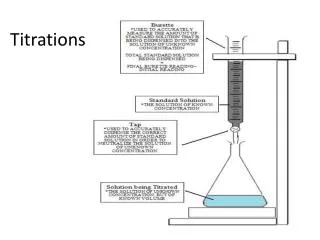
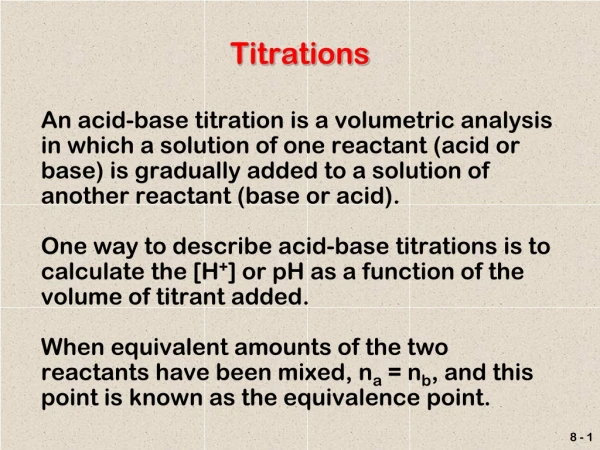
Titrations • Introduction • 2.)Volumetric analysis • Procedures in which we measure the volume of reagent needed to react with an analyte 3.) Titration • Increments of reagent solution (titrant) are added to analyte until reaction is complete. - Usually using a buret • Calculate quantity of analyte from the amount of titrant added. • Requires large equilibrium constant • Requires rapid reaction - Titrant is rapidly consumed by analyte Controlled Chemical Reaction
Analyte Oxalic acid (colorless) Titrant (purple) (colorless) (colorless) Titrations • Introduction 4.) Equivalence point • Quantity of added titrant is the exact amount necessary for stoichiometric reaction with the analyte - Ideal theoretical result Equivalence point occurs when 2 moles of MnO4- is added to 5 moles of Oxalic acid
Titrations • Introduction 5.) End point • What we actually measure • - Marked by a sudden change in the physical property of the solution • - Change in color, pH, voltage, current, absorbance of light, presence/absence ppt. CuCl Titration with NaOH End Point After the addition of 8 drops of NaOH Before any addition of NaOH
Analyte Oxalic acid (colorless) Titrant (purple) (colorless) (colorless) Titrations • Introduction 5.) End point • Occurs from the addition of a slight excess of titrant - Endpoint does not equal equivalence point After equivalence point occurs, excess MnO4- turns solution purple Endpoint
Titrations • Introduction 5.) End point • Titration Error • - Difference between endpoint and equivalence point • - Corrected by a blank titration • i. repeat procedure without analyte • ii. Determine amount of titrant needed to observe change • iii. subtract blank volume from titration • Primary Standard - Accuracy of titration requires knowing precisely the quantity of titrant added. - 99.9% pure or better accurately measure concentration Analyte Oxalic acid (colorless) Titrant (purple)
Titrations • Introduction 6.) Standardization • Required when a non-primary titrant is used • - Prepare titrant with approximately the desired concentration • - Use it to titrate a primary standard • - Determine the concentration of the titrant • - Reverse of the normal titration process!!! Titration Standardization titrant known concentration titrant unknown concentration analyte unknown concentration analyte known concentration
Titrations • Introduction 7.) Back Titration • Add excess of one standard reagent (known concentration) • - Completely react all the analyte • - Add enough MnO4- so all oxalic acid is converted to product • Titrate excess standard reagent to determine how much is left - Titrate Fe2+ to determine the amount of MnO4- that did not react with oxalic acid - Differences is related to amount of analyte - Useful if better/easier to detect endpoint Analyte Oxalic acid (colorless) Titrant (purple) (colorless) (colorless)
Titrations • Titration Calculations 1.) Key – relate moles of titrant to moles of analyte 2.) Standardization of Titrant Followed by Analysis of Unknown Calculation of ascorbic acid in Vitamin C tablet: • Starch is used as an indicator: starch + I3- starch-I3- complex • (clear) (deep blue) (ii) Titrate ascorbic acid with I3-: 1 mole ascorbic acid 1 mole I3-
Titrations • Titration Calculations 2.) Standardization of Titrant Followed by Analysis of Unknown Standardization: Suppose 29.41 mL of I3- solution is required to react with 0.1970 g of pure ascorbic acid, what is the molarity of the I3- solution?
Titrations • Titration Calculations 2.) Standardization of Titrant Followed by Analysis of Unknown Analysis of Unknown: A vitamin C tablet containing ascorbic acid plus an inert binder was ground to a powder, and 0.4242g was titrated by 31.63 mL of I3-. Find the weight percent of ascorbic acid in the tablet.
Titrations • Spectrophotometric Titrations 1.) Use Absorbance of Light to Follow Progress of Titration • Example: • - Titrate a protein with Fe3+ where product (complex) has red color • - Product has an absorbance maximum at 465 nm • - Absorbance is proportional to the concentration of iron bound to protein Analyte (colorless) titrant (colorless) (red) As Fe3+ binds protein solution turns red
Titrations • Spectrophotometric Titrations 1.) Use Absorbance of Light to Follow Progress of Titration • Example: • - As more Fe3+ is added, red color and absorbance increases, • - When the protein is saturated with iron, no further color can form • - End point – intersection of two lines (titrant has some absorbance at 465nm) When all the protein is bound to Fe3+, no further increase in absorbance. As Fe3+ continues to bind protein red color and absorbance increases.
Titrations • Spectrophotometric Titrations 1.) Use Absorbance of Light to Follow Progress of Titration • Example: • - As more Fe3+ is added, concentration changes due to dilution • - Need to correct absorbance for dilution. Total volume changes after each addition
Titrations • Precipitation Titration Curve 1.) Graph showing how the concentration of one of the reactants varies as titrant is added. • Understand the chemistry that occurs during titration • Learn how experimental control can be exerted to influence the quality of an analytical titration - No end point at wrong pH - Concentration of analyte and titrant and size of Ksp influence end point - Help choose indicator for acid/base and oxidation/reduction titrations Sharpness determined by titration condition Monitor pH, voltage, current, color, absorbance, ppt.
Titrations • Precipitation Titration Curve 2.) Because concentration varies over many orders of magnitude, plot p function 3.)Example: p function: where [X] is concentration of X Consider the titration of 25.00 mL of 0.1000M I- with 0.05000M Ag+ Since Ksp is so small, each addition of Ag+ reacts completely with I-
Titrations • Precipitation Titration Curve 3.)Example: At equivalence point, sudden increase in Ag+ concentration. - All I- has been consumed What volume (Ve) of Ag+ titrant is need to reach the equivalence point? mol Ag+ mol I- One mole of Ag+ reacts with one mol I-
Titrations • Precipitation Titration Curve 4.) Three distinct regions in titration curve • Before, at and after the equivalence point. • Before the Equivalence Point - All titrant [Ag+] is consumed, free [I-] is [I-] that has not been precipitated. - Negligible I- from AgI(s) (Ksp) after at before Moles of I- = original moles of I- - moles of Ag+ added
Titrations • Precipitation Titration Curve 4.) Three distinct regions in titration curve • Before the Equivalence Point - Concentration of Ag+ is governed by Ksp Consider the titration of 25.00 mL of 0.1000M I- with 10 mL of 0.05000M Ag+ Moles of I- = original moles of I- - moles of Ag+ added Volume is 0.3500 L ( 25.00 mL + 10.00 mL) Concentration of Ag+ in equilibrium with this much I-
Titrations • Precipitation Titration Curve 4.) Three distinct regions in titration curve • Before the Equivalence Point • - Concentration of Ag+ is governed by Ksp • At Equivalence Point - added exactly enough Ag+ to react with all I- - [Ag+] independent of the original concentrations - [Ag+] dependent on Ksp p function 2 sig. fig. 2 sig. fig. in the mantissa of p function
Titrations • Precipitation Titration Curve 4.) Three distinct regions in titration curve • After Equivalence Point - All Ag+ added before equivalence point has ppt. - [Ag+] is determined by Ag+ added after the equivalence point. > volume after equivalence point For 2 mL of Ag+ added past equivalence point
Titrations • Shape of Titration Curve 1.) Equivalence point is the steepest point of the curve. • Point of maximum slope inflection point second derivative is zero
Titrations • Shape of Titration Curve 2.) Affect of Ksp on Titration Curve. • Lowest solubility gives steepest change at equivalence point Magnitude of concentration change and ease of identifying equivalence point increases with Ksp
Titrations • Titration of a Mixture 1.) Product with the Smaller Ksp Precipitates First • Two Stage Titration Curve - Assumes significant difference in Ksp First, AgI ppt. Titrate Mixture of KI and KCl with AgNO3 Then, AgCl ppt. Ksp(AgI) << Ksp(AgCl) AgI ppt. not complete at midpoint
Titrations • End-Point Detection 1.) Precipitation Titration • End points detected with electrode or indicator - Electrode – converts concentration of specific ion into measurable current or potential. - Indicators: Volhard titration: formation of a soluble, colored complex at the end point Fajans titration: adsorption of a colored indicator on the precipitate at the end point pH electrode responds to [H+]
Titrations • End-Point Detection 1.) Precipitation Titration • Volhard titration (First Published in 1874) Determine [Cl-]: First ppt. Cl- by titration with Ag+and filter off solid Titrate excess Ag+with thiocyanate (SCN-) When all Ag+ is consumed,thiocyanate binds Fe3+. Appearance of Red color is endpoint Total amount of Ag+ is known, so amount consumed by Cl- can be calculated Subtract excess [Ag+] from total [Ag+] used to ppt. Cl-
AgCl ppt. Precipitate surface is initially negatively charged due to excess Cl- AgCl ppt. After equivalence point (end point), have excess Ag+ so surface is now positively charged. Anionic dye is attracted to positive charged surface. Adsorption of dye causes color change Titrations • End-Point Detection 1.) Precipitation Titration • Fajans titration - Uses an adsorption indicator
Titrations • End-Point Detection 1.) Precipitation Titration • Fajans titration • Anionic dyes - Maximize surface area higher binding stronger color change - small particle size low concentration - most use appropriate pH to maintain negative charge Sharper color transition, binds to tightly to Cl- Changes from greenish yellow to pink
Titrations • End-Point Detection 2.) Typical Applications • Also indicates potential sources of interference - other ions/analytes may be present in sample