1 / 18
Data Ratios and Lock-In Phases Visualization Tool
180 likes | 244 Vues
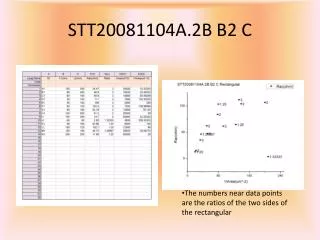
This tool displays ratios of data points and lock-in phases, helping to analyze rectangular data. Explore and interpret data with ease.
Télécharger la présentation
Data Ratios and Lock-In Phases Visualization Tool
An Image/Link below is provided (as is) to download presentation
Download Policy: Content on the Website is provided to you AS IS for your information and personal use and may not be sold / licensed / shared on other websites without getting consent from its author.
Content is provided to you AS IS for your information and personal use only.
Download presentation by click this link.
While downloading, if for some reason you are not able to download a presentation, the publisher may have deleted the file from their server.
During download, if you can't get a presentation, the file might be deleted by the publisher.
E N D
Presentation Transcript
STT20081104A.2B B2 C • The numbers near data points are the ratios of the two sides of the rectangular
STT20081104A.2B B3 C The numbers near data points are the phases from lock-in
STT20081104A.2A B2 C The numbers near y-axis is the phases from lock-in
STT20080924A.1B B2 C G10 : 80nm*160nm X : B(T) | Y : f(Hz) | Z : dU/dB(V/T)
STT20080924A.1B B2 C G10 : 80nm*160nm X : B(T){Decrease : left ; Increase : right} | Y : f(Hz) | Z : Rac(ohm)
STT20080924A.1B B2 C G10 : 80nm*160nm X : B(T){Decrease : left ; Increase : right} | Y : f(Hz) | Z : Uhom(V)
More Related