Download
1 / 37
370 likes | 568 Vues
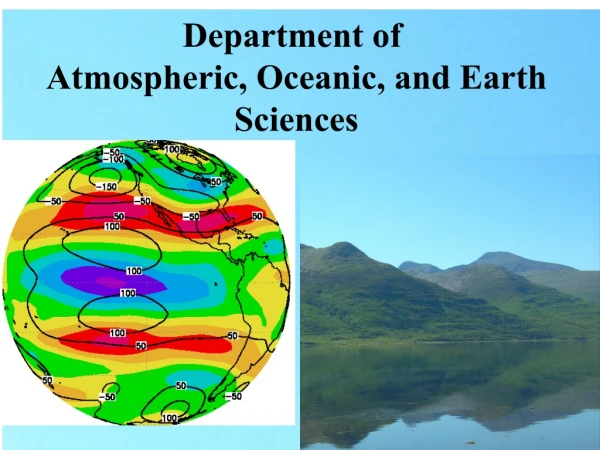
Why is the Stratosphere More Predictable and What are the Implications for Seasonal Predictions of the Troposphere?. Ming Cai Department of Earth, Ocean, and Atmospheric Science, Florida State University. Acknowledgement: Huug M. van den Dool, Qin Zhang

E N D
Why is the Stratosphere More Predictable and What are the Implications for Seasonal Predictions of the Troposphere? Ming Cai Department of Earth, Ocean, and Atmospheric Science, Florida State University Acknowledgement: Huug M. van den Dool, Qin Zhang Rongcai Ren, Chul-Su Shin, and YY-Yu Grant Support: NOAA CPO: NA10OAR4310168
Outline • Motivation and theoretical background. • Observational evidence linking tropical-extratropical coupling coupling to meridional mass circulation and its variability. • Modeling evidence of high predictability of the stratosphere beyond the two-week limit. • Mass circulation variability and cold air outbreaks in winter seasons
Sources of Prediction Skill • NWP: initial value problem. Rossby waves and baroclinic system => chaotic nature => inherent predictability (1-2 weeks). • NWP+lower boundary forcing: “forced” problems Internal variability often is as large as the forced anomalies, particularly in the absence of large SST anomalies (e.g. non ENSO years) and over the regions where prominent atmospheric internal modes are present at all time scale =>the forecasts of the “forced” anomalies are indecisive. • New Source: Global mass circulation => The extratropics is connected to the tropics via stratosphere: =>Much a longer time scale.
Timely and zonally averaged circulation in pressure/height coordinates From ECMWF ERA-40 Atlas Pressure (hPa) S N EQ
Mean meridional mass circulation in winter hemisphere (Cai and Shin 2013)
Vertical and meridional couplings by baroclinically amplifying (westward tilting) waves (Johnson 1989) • A net poleward (adiabatic) transport of warm air mass aloft and a net equatorward (adiabatic) transport of cold air mass transport below.
Upper level A net warm air transport poleward at upper layers Less mass More mass A net cold air transport equatorward at lower layers Middle level More mass Less mass Lower level high cold low warm high Westward tilting waves and meridional mass transport Johnson (1979) and Townsend and Johnson (1985)
Observational evidence linking tropical-extratropical coupling to meridional mass circulation and its variability (derived from NCEP/NCAR reanalysis:1979-2003) Cai (2003, GRL)Cai and Ren (2006, GRL) Ren and Cai (2006, AAS) Cai and Ren (2007, JAS) Ren and Cai (2007, GRL)
+NAM -NAM/SSW Daily time series of NH Polar vortex oscillation 69% variance of NH daily PV anomalies 1979-83 1984-88 1989-93 1994-98 A see-saw pattern between mid-lat. and high-lat., & between polar stratosphere and polar troposphere. 1998-03 Time
10mb 150mb 500mb 200mb 850mb 20mb 50mb 250mb 925mb 300mb 1000mb 100mb Lead day of PVO index (-60 ~60) Meridional propagation of thermal anomalies Upper layers totally in the ST Middle layers across the Tropopause Troposphere 150 hPa 500 hPa 10 hPa 200 hPa 850 hPa 20 hPa 250 hPa 925 hPa 50 hPa 300 hPa 1000 hPa 100 hPa
30N 10N 20N 40N 50N 70N 60N 80N Lead day of PVO index (-60 ~60) Downward Propagation of thermal anomalies 10 N 20 N 30 N 40 N height 50 N 60 N 70 N 80 N
Summary of theoretical background: • Stratospheric annular mode variability is intimately associated with variability of the stratospheric part of the warm air branch mass circulation. • Positive phase corresponds to the state of a weaker meridional mass circulation whereas the negative phase results from a stronger meridional mass circulation. • Presence of large-amplitude westward titling waves leads to a stronger poleward mass transport. • Limited meridional scale of westward titling waves results in successive poleward progress of stronger poleward mass transport => slow time scale of annular mode variability.
A numerical model may still have a good skill in predicting stratospheric annular mode variability even when it already loses its skill in predicting the exact locations of individual planetary-scale waves, as long as it can retain the amplitude and westward tilting of these waves. Implications for stratosphere predictions:
NCEP CFSv2 Prediction Skill for Stratospheric Variability(Zhang, Shin, van den Dool, and Cai 2013)Day 1 through Day 90 forecastsfor the period from January 1, 1999 to December 2010
Forecast evaluation procedure • Remove annual cycle of CFSv2 reanalysis (observation) from CFSv2 daily forecasts at all lead times. • Consider Temperature anomalies at 50 hPa (T50 stratosphere) and 500 hp (T500, troposphere). • Verify anomalies of CFSv2 CFSv2 forecasts against anomalies of CFS reanalysis (observations). • Use either map correlation for temporal-spatial field or temporal correlation for time series of anomalies to measure the skill of CFSv2 (AC > 0.5 reliable forecasts and AC > 0.3 useful forecasts) • Calculate the same skill for “persistence forecasts”. The gain of CFSv2 skill over persistence forecasts measures the usefulness of CFSv2 forecasts.
Overall skill (map AC) SH NH T50 T50 T500 15days T500 18days Forecast lead time (days)
Seasonal dependency of CFSv2 skill over polar stratosphere SH NH
18.6% 23.4% NH only 1st 4 EOF modes of daily T50 anomalies 13.4% 5.2%
17 AC skill of predictions of PCs of EOF1-4 11 24 36
Summary (1) • The NCEP CFSv2 still has a remarkable prediction skill of polar stratospheric temperature anomalies at the lead time of 30 days whereas its counterpart in the troposphere at 500 hPa drops very quickly and below the 0.3 level at 12 days. We also prove that the CFSv2 has a high prediction skill both in an absolute sense and in terms of gain over persistence except in the equatorial region where the skill mainly comes from the persistence of the QBO signal. • In particular, the CFSv2 is capable of predicting mid-winter polar stratosphere sudden warming events in the Northern Hemisphere and the timing of the final warming polar stratosphere warming in both hemispheres 3-4 weeks in advance. • The remarkable skill comes from the signal of systematic poleward propagation of thermal anomalies from the equator to the pole in the stratosphere associated with the global mass circulation variability (intensity/time scale). • As long as the westward tilting of planetary waves in the stratosphere and their overall amplitude can be captured, the CFSv2 forecasts would still be very skillful in predicting zonal mean anomalies even though it cannot do so for the exact locations of planetary waves and their spatial scales.
Mass circulation variability and cold air outbreaks in winter seasons Cai (2003, GRL)Cai and Ren (2007, JAS) Cai and Yu (2013)
40 days 70 days Meridional propagation (Cai and Ren 2007) Poleward propagation in the stratosphere Equatorward propagation in troposphere 2 Periods
Mass circulation variability and cold air outbreaks in the mid-latitudes Weaker Meridional Mass Circulation Stronger Meridional Mass Circulation 90N 90N Warm air Warm air 60N 60N Cold air Cold air 25N 25N Less cold air outbreaks in mid-latitudes Coldness in high latitudes More cold air outbreaks in mid-latitudes Warmness in high latitudes
Total mass flux into polar cap in the warm air branch • Total mass flux out of polar cap in the cold air branch • Total mass flux into polar cap in the stratosphere Indices of mass circulation
Coldness indices • Percentage of area occupied by negative temperature anomalies below n*standard_deviation (local) in high latitude zone (60 N poleward) and mid-latitudes (between 25 and 60N), with n = 0, 0.5, 1, 1.5, 2.0 etc.. • The areal mean of temperature anomalies below n*standard_deviation (local) in high latitude zone (60 N poleward) and mid-latitudes (between 25 and 60N), with n = 0, 0.5, 1, 1.5, 2.0 etc.. Indices of coldness and warmness Warmness indices: same as coldness indices except for positive temperature anomalies above n*standard_deviation (local). The results with n = 0 are representative
High-Lat Mid-Lat Area Example of circulation and temperature indices (after removing their annual cycles) Amp. Mass circulation
High Lat. Mid-latitudes Example of lead/lag correlation between circulation and temperature indices Lag days of warm air branch MV Lag days of warm air branch MV Lag days of Stratosphere MV Lag days of Stratosphere MV
Stratosphere mass circulation versus warm/cold air branch circulations Warm air branch Cold air branch Lag days of Stratosphere MV Lag days of Stratosphere MV
Stratosphere mass circulation versus temperature indices Coldness area indices Warmness area indices > 60N 25-60N > 60N 25-60N Lag days of Stratosphere MV Lag days of Stratosphere MV
Stratosphere mass circulation versus temperature indices Coldness area indices (n =1) Warmness area indices (n=1) > 60N 25-60N > 60N 25-60N Lag days of Stratosphere MV Lag days of Stratosphere MV
Stratosphere mass circulation versus temperature indices High Lat. Mid Lat. Coldness Warmness
Summary (2) • Variability of mass flux into polar stratosphere is synchronized with that of warm air branch and cold air branch. • Surface temperature anomalies in winter seasons are intimately coupled with the timing/intensity of global mass circulation variability. • Lack of warm air into polar stratosphere is accompanied by weaker equatorward advancement of cold air near the surface. As a result, the cold air mass is largely imprisoned within polar circle, responsible for general warmness in mid-latitudes and below climatology temperature in high latitudes. • Stronger warm air into polar stratosphere is accompanied by stronger equatorward advancement of cold air near the surface, resulting in massive cold air outbreaks in mid-latitudes and warmth in high latitudes.
A hybrid forecasting strategy for intraseasonal cold season climate predictions (14 - 60? days) • Prognostic component: Dynamical prediction for (extratropic) stratospheric anomalies using CFS • Diagnostic component: Statistical “instantaneous” relations between stratospheric and surface temperature anomalies (downscaling) • Potential products: • Likelihood of series and severe winter storms in a time span of a few weeks over a continental domain. • Mild versus cold winter season. • Timing of the coldest period (“early” versus “late” winter).