Download
1 / 1
10 likes | 205 Vues
On the Global Warming Rate Zhaohua Wu Department of Earth, Ocean, and Atmospheric Science. Motivations The Earth has warmed at an unprecedented pace in recent decades (IPCC 2007).

E N D
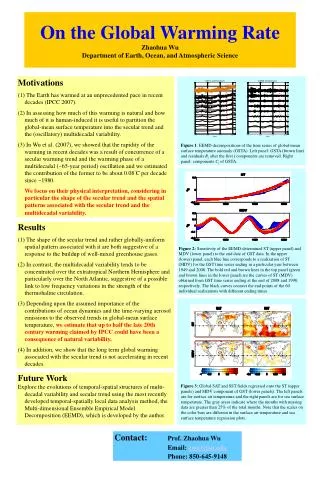
On the Global Warming RateZhaohua WuDepartment of Earth, Ocean, and Atmospheric Science • Motivations • The Earth has warmed at an unprecedented pace in recent decades (IPCC 2007). • In assessing how much of this warming is natural and how much of it is human-induced it is useful to partition the global-mean surface temperature into the secular trend and the (oscillatory) multidecadal variability. • In Wu et al. (2007), we showed that the rapidity of the warming in recent decades was a result of concurrence of a secular warming trend and the warming phase of a multidecadal (~65-year period) oscillation and we estimated the contribution of the former to be about 0.08°C per decade since ~1980. • We focus on their physical interpretation, considering in particular the shape of the secular trend and the spatial patterns associated with the secular trend and the multidecadal variability. • Results • The shape of the secular trend and rather globally-uniform spatial pattern associated with it are both suggestive of a response to the buildup of well-mixed greenhouse gases. • In contrast, the multidecadal variability tends to be concentrated over the extratropical Northern Hemisphere and particularly over the North Atlantic, suggestive of a possible link to low frequency variations in the strength of the thermohaline circulation. • Depending upon the assumed importance of the contributions of ocean dynamics and the time-varying aerosol emissions to the observed trends in global-mean surface temperature, we estimate that up to half the late 20th century warming claimed by IPCC could have been a consequence of natural variability. • In addition, we show that the long term global warming associated with the secular trend is not accelerating in recent decades. • Future Work • Explore the evolutions of temporal-spatial structures of multi-decadal variability and secular trend using the most recently developed temporal-spatially local data analysis method, the Multi-dimensional Ensemble Empirical Model Decomposition (EEMD), which is developed by the author. Figure 1: EEMD decompositions of the time series of global-mean surface temperature anomaly (GSTA). Left panel: GSTA (brown line) and residuals Rjafter the first j components are removed. Right panel: components Cj of GSTA. Figure 2: Sensitivity of the EEMD-determined ST (upper panel) and MDV (lower panel) to the end date of GST data. In the upper (lower) panel, each blue line corresponds to a realization of ST (MDV) for the GST time series ending in a particular year between 1949 and 2008. The bold red and brown lines in the top panel (green and brown lines in the lower panel) are the curves of ST (MDV) obtained from GST time series ending at the end of 2008 and 1998, respectively. The black curves connect the end points of the 60 individual realizations with different ending times. Figure 3: Global SAT and SST fields regressed onto the ST (upper panels) and MDV component of GST (lower panels). The left panels are for surface air temperature and the right panels are for sea surface temperature. The gray areas indicate where the months with missing data are greater than 25% of the total months. Note that the scales on the color bars are different in the surface air temperature and sea surface temperature regression plots. Contact: Prof. Zhaohua Wu Email: zwu@fsu.edu Phone: 850-645-9148