Network Information Base (NIB) visualization system
This document introduces the Network Information Base (NIB) visualization system, designed to manage complex, evolving networks through a centralized database and real-time visualization tools. It aggregates detailed information about various network types (Ethernet, Wi-Fi, Bluetooth, Zigbee, Cellular) and Management Information Base (MIB) objects, allowing network administrators to observe network status efficiently. Our system aims to streamline analysis and management, minimizing the expertise required for effective oversight. Future enhancements will expand supported network types and improve information presentation.


Network Information Base (NIB) visualization system
E N D
Presentation Transcript
Network Information Base (NIB) visualization system Team Member: Dakuo Wang, Li Zhang, Xuejie Sun, Yang Liu
Introduction • We can design Network Information Base (NIB) visualization system to manage complex, evolving networks under given multi-network overlay construction algorithm. • In order to build a network management dashboard, first it needs all the collected information (in a certain schema) stored in a database located in the central server. This conceptual global database should contain detailed information about the topology of different network (Ethernet, Wi-Fi, Bluetooth, Zigbee, Cellular) and protocol related Management Information Base (MIB) objects. • Then it needs a visualization tool that enables the network administrator to visually observe the network status in real time.
Related Work & Contribution • Researchers have come up with several network management protocols/systems to manage and supervise the networks. To deal with the multi-vendor environment of the typical installation, a network-management system is needed that is based on standardized network-management protocols and applications. Among which, the most outstanding ones are SNMP, SNMS, L-SNMS, LNMP, MINA and so on. • Why is this our system interesting? The most efficient way to analyze a network is to get data directly from database and do analysis, while in nowadays network scale, which is not possible. Even in small-scale networks, the analysis still requires expertise skills and knowledge. Our system is a useful tool to help not only administrators but also engineers to understand the network, moreover, to handle the network.
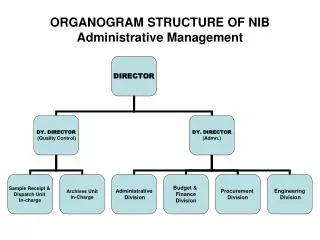
Architecture of NIB Visualization System • DATABASE • Background Java Program (server end) • Front-end user interface (Visualization)
Database • The database uses mySQL and contains four kinds of network: Ethernet, WiFi, Bluetooth, Zigbee, Cellular. • Three steps: • Extend the records in the database. • Add more kinds of network into the database. • Write script to update the database.
2. Background Java Program (server end) • Read data from Data Base, including DB API. • Periodically refresh JSON data for front-end UI (web-based JavaScript) display. • Display the system information on the user interface, for administrator to debug the system.
Java Program • Java background server end program user interface
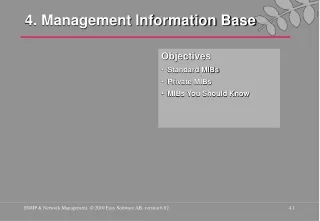
3. Front End User Interface (Visualization) The visualization should include: • Node representation information. • Link representation information. Both with several obvious characteristics and some information for supervision of the network.
Front-end user interface (on device) • We used JavaScript for this part, it can displayed on any web browser, including IPhone Safari and Android.
Conclusion • We have design and implement a Network Information Base Visualization (NIBV) system based on the work of NIB system. Our goal is to build a user-friendly interface on the top of complex network topology. This NIBV system could dynamically reflect the change of the network. • The future work would be supporting more network types by the system. Also, the information presented by the visualization is very limited. The enhancement of the information presenting is another direction of our further work.