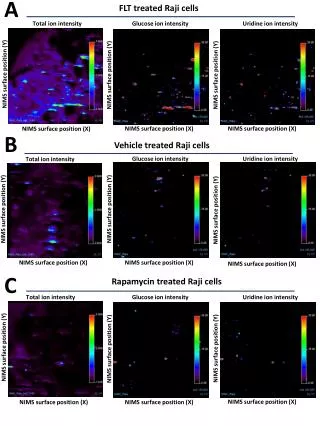
Analysis of Ion Intensities and Surface Positions in NIMS for Glucose and Uridine
This study investigates the ion intensity measurements of glucose and uridine, utilizing NIMS (Nano-Impact Mass Spectrometry) to understand their distribution across varying surface positions. The analysis encompasses total ion intensity, glucose ion intensity, and uridine ion intensity, in correlation with designated positions on the NIMS surface. Results reveal key spatial variations and density patterns in cellular environments, contributing to enhanced knowledge of metabolite behavior in biological systems at the micro-scale.

Analysis of Ion Intensities and Surface Positions in NIMS for Glucose and Uridine
E N D
Presentation Transcript
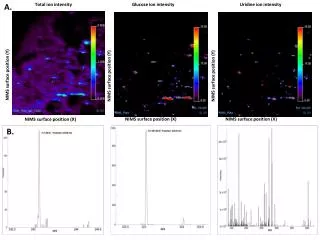
Glucose ion intensity A. Total ion intensity NIMS surface position (Y) Uridine ion intensity NIMS surface position (Y) 1 CELL NIMS surface position (X) NIMS surface position (Y) NIMS surface position (X) 2 CELLS NIMS surface position (X) B.