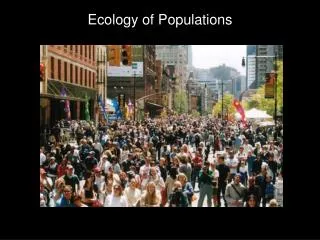
Ecology: Populations
Ecology: Populations . Organizational Hierarchy of Life . Most Complex. biosphere ecosystem community population organism organ system organ tissue cell organelle macromolecule molecule atom sub-atomic particles. Living. Non-living. Least Complex. What Is a Population?.

Ecology: Populations
E N D
Presentation Transcript
Organizational Hierarchy of Life Most Complex biosphere ecosystem community population organism organ system organ tissue cell organelle macromolecule molecule atom sub-atomic particles Living Non-living Least Complex
What Is a Population? All members of a particular species who live within an ecosystem and can potentially interbreed
What Factors Influence Population Size? Change in population size = (births – deaths) + (immigrants – emigrants) Migration is often less of an influence than birth and death rates.
What Factors Influence Birth and Death Rates? • Biotic potential • maximum rate at which population could increase, given ideal conditions • Environmental Resistance • limits on growth set by living and non-living components of the environment
What Factors Cause Exponential Growth? • Exponential Growth: number of individuals increases at a constant rate • continuously accelerating increase in size • occurs when a species is introduced into a new, unoccupied habitat • resources are unlimited • births consistently exceed deaths
Exponential Growth Curve (J-curve) Occurs when biotic potential is unlimited
What Factors Influence Biotic Potential? • Age of first reproduction • Frequency of reproduction • Average number of offspring produced with each reproductive event • Length of reproductive life span • Death rate of individuals under ideal conditions
Exponential Growth CurveAffected by Start of Reproduction Reproduction began at 4 years (i) Reproduction began at 6 years (ii)
Effect of Death Rates on Population Growth bacteria Nodeaths 10% diebetweendoublings 25% diebetweendoublings
Exponential Growth Is Part of a Boom-and-Bust Population Cycle Cycle: Exponential growth when conditions are good (boom)Population rapidly declines when conditions are bad (bust)
Lemming Population Cycles Population decline caused by • overgrazing of tundra • increasing numbers of predators • social stress
What Factors Limit Population Growth? Environmental Resistance is caused by • Density-Independent Factors • unrelated to population density • weather and other natural events • human activities, including pollution • Density-Dependent Factors • related to the number of individuals per given area • involve interactions within the community, including predation, parasitism, competition
The S-Curve of Population Growth Number of Individuals Time (environmental resistance) Carrying Capacity (bioticpotential) Equilibrium ExponentialGrowth
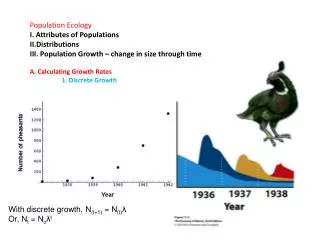
Carrying Capacity Growth rate = 0 Growth rate slows down • Pleasant Island Pheasants • 1937 – 8 pheasants introduced • 1945 – 1325 pheasants on island • 1947 – 1600 pheasants on island
Why Did the Pheasant Population Stabilize? • Females were laying the same number of eggs • Death rate increased, number of surviving chicks decreased
Carrying Capacity • Maximum population size indefinitely supported by available resources • Determined by sustained availability of • renewable resources such as nutrients, water and light • space • Influenced by environmental resistance
Grand Canyon Kaibab Deer • 1907 – 4000 deer on Kaibab Plateau • beginning in 1907– removal of predators • 1924 – 100,000 deer • very severe winter in 1925-26 • 1927 – 10,000 deer
What Were the Effects of the Deer Population at Its Peak? • Forest was over browsed leading to • Loss of ground cover • Soil compaction – less water and increased erosion • Carrying capacity reduced for years
Applying Your Knowledge • Biotic Potential • Environmental Resistance • J-Curve • S-Curve • Carrying Capacity • Does choice 3 or 4 show exponential growth? • Does choice 1 or 2 represent the effects of pollution on population size? • Which choice (1-5) represents the maximum population size that can be supported by an environment over a long period of time?
R-selected Versus K-selected Strategies mammals weeds, insects J-curve S-curve many few small large slow rapid extensive little or none once per lifetime multiple times
Random Clumped Uniform Population Distributions
Human Population Growth Human population reached 6 billion on October 12, 1999
Population Growth Rates:Developed & Developing Countries DevelopingCountries Developed Countries
Generalized Age-Structure Diagrams Post-Reproductive(46-100 y old) Reproductive(15-45 y old) Pre-Reproductive(0-14 y old) Expanding Stable Contracting
Population Growth by World Regions World Average 1.4% Developed Countries 0.1% Developing Countries 1.7% Africa 2.4% Latin America/Caribbean 1.8% Asia (excluding China) 1.7% China 0.9% NorthAmerica 0.6% Europe -0.1% -0.5 0 0.5 1 1.5 2 2.5 3 Natural Increase (annual %)
U.S. Population Growth Factors contributing to U.S. population growth • “baby boom” • immigration U.S. has 5% of world’s population but • uses 25% of world’s energy • releases more greenhouse gases than 16x more people in Asia
Population Predictions • Extreme (Paul Ehrlich) – Population will probably crash with 50%-80% dying due to war, famine, disease, & ecological collapse (density dependent factors). • Middle - Widespread famine and disease will hit some areas of the world, but basic food supply probably sufficient through 2020. • Optimistic – Improving technology will avert these disasters.