Download

1 / 100
1.12k likes | 1.54k Vues
4. Ecology and evolution: Populations, communities, and biodiversity. This lecture will help you understand:. How evolution generates biodiversity Speciation, extinction, and the “biodiversity crisis” Population ecology Community ecology Species interactions Conservation challenges

E N D
4 Ecology and evolution: Populations, communities, and biodiversity
This lecture will help you understand: • How evolution generates biodiversity • Speciation, extinction, and the “biodiversity crisis” • Population ecology • Community ecology • Species interactions • Conservation challenges • Evolution by natural selection
Key Words adaptation adaptive trait age distribution age structure age structure diagrams allopatric speciation anthropogenic artificial selection biodiversity biological diversity biosphere biotic potential carnivores carrying capacity climax community clumped distribution community competition decomposers host immigration interspecific competition intraspecific competition invasive species keystone species K-strategist limiting factors logistic growth mass extinction mutations mutualism natural selection niche omnivores parasite parasitism density dependent detritivores ectoparasites Emigration endemic endoparasites environmental resistance evolution exponential growth extinction food chain food web fossil fossil record growth rate habitat selection habitats herbivores heritable
Key Words sex ratio speciation species succession symbioses tertiary consumers trophic levels uniform distribution phylogenetic trees pioneer species pollination population density population dispersion population distribution population growth curves population size predation predator prey primary consumers primary succession random distribution resource partitioning r-strategists secondary consumers secondary succession
Central Case: Striking Gold in a Costa Rican Cloud Forest • The golden toad of Monteverde, discovered in 1964, had disappeared 25 years later. • Researchers determined that warming and drying of the forest was most likely responsible for its extinction. • As the global climate changes, more such events can be expected.
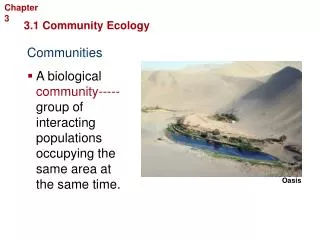
Biodiversity Biodiversity, or biological diversity, is the sum of an area’s organisms, considering the diversity of species, their genes, their populations, and their communities. A species is a particular type of organism; a population or group of populations whose members share certain characteristics and can freely breed with one another and produce fertile offspring.
Biodiversity • Costa Rica’s Monteverde cloud forest is home to many species and possesses great biodiversity. Figure 5.1
Natural selection • Natural selection rests on three indisputable facts: • • Organisms produce more offspring than can survive. • • Individuals vary in their characteristics. • • Many characteristics are inherited by offspring from parents.
THEREFORE, logically… • Some individuals will be better suited to their environment; they will survive and reproduce more successfully. • These individuals will transmit more genes to future generations. • Future generations will thus contain more genes from better-suited individuals. • Thus, characteristics will evolve over time to resemble those of the better-suited ancestors. Natural selection
Natural selection • Fitness = the likelihood that an individual will reproduce • and/or • the number of offspring an individual produces over its lifetime • Adaptive trait, • oradaptation = a trait that increases an individual’s fitness
Natural selection • Evidence of natural selection is all around us: • In nature … • Diverse bills have evolved among species of Hawaiian honeycreepers. Figure 4.23a
Fruit and seed eaters Insect and nectar eaters Greater Koa-finch Kuai Akialoa Amakihi Kona Grosbeak Crested Honeycreeper Akiapolaau Apapane Maui Parrotbill Unknown finch ancestor Beak Types Resulting From Natural Selection
Natural selection • Evidence of natural selection is all around us: • … and in our domesticated organisms. Dog breeds, types of cattle, improved crop plants—all result from artificial selection (natural selection conducted by human breeders). Figure 4.23b
Speciation • The process by which new species come into being • Speciation is an evolutionary process that has given Earth its current species richness—more than 1.5 million described species and likely many million more not yet described by science. • Allopatric speciation is considered the dominant mode of speciation, and sympatric speciation also occurs.
Allopatric speciation 1. Single interbreeding population 2. Population divided by a barrier; subpopulations isolated Figure 5.2
Allopatric speciation • 3. The two populations evolve independently, diverge in their traits. • 4. Populations reunited when barrier removed, but are now different enough that they don’t interbreed. Figure 5.2
Allopatric speciation • Many geological and climatic events can serve as barriers separating populations and causing speciation. on.
Chemical Evolution (1 billion years) Formation of the earth’s early crust and atmosphere Small organic molecules form in the seas Large organic molecules (biopolymers) form in the seas First protocells form in the seas Biological Evolution (3.7 billion years) Single-cell prokaryotes form in the seas Single-cell eukaryotes form in the seas Variety of multicellular organisms form, first in the seas and later on land
Stanley Miller's experiment animation. Click to view animation.
Stabilizing Selection Click to view animation.
Disruptive Selection Click to view animation.
Niche separation Generalistspecies with a broad niche Number of individuals Specialistspecies with a narrow niche Niche breadth Region of niche overlap Resource use Niches and Natural Selection
Herring gull is a tireless scavenger Brown pelican dives for fish, which it locates from the air Black skimmer seizes small fish at water surface Dowitcher probes deeply into mud in search of snails, marine worms, and small crustaceans Ruddy turnstone searches under shells and pebbles for small invertebrates Scaup and other diving ducks feed on mollusks, crustaceans, and aquatic vegetation Avocet sweeps bill through mud and surface water in search of small crustaceans, insects, and seeds Flamingo feeds on minute organisms in mud Oystercatcher feeds on clams, mussels, and other shellfish into which it pries its narrow beak Knot (a sandpiper) picks up worms and small crustaceans left by receding tide Louisiana heron wades into water to seize small fish Piping plover feeds on insects and tiny crustaceans on sandy beaches Various Niches and Their Adaptations
Arctic Fox Northernpopulation Spreads northward and southward and separates Adapted to cold through heavier fur, short ears, short legs, short nose. White fur matches snow for camouflage. Different environmental conditions lead to different selective pressures and evolution into two different species. Early fox population Southernpopulation Gray Fox Adapted to heat through lightweight fur and long ears, legs, and nose, which give off more heat. Geographic Separation
Bombardier beetle Span worm Wandering leaf insect Foul-tasting monarch butterfly When touched, the snake caterpillar changes shape to look like the head of a snake Poison dart frog Viceroy butterfly mimics monarch butterfly Hind wings of io moth resemble eyes of a much larger animal Mimicry
Phylogenetic trees • Life’s diversification results from countless speciation events over vast spans of time. • Evolutionary history of divergence is shown with diagrams called phylogenetic trees. • Similar to family genealogies, these show relationships among organisms.
Phylogenetic trees These trees are constructed by analyzing patterns of similarity among present-day organisms. This tree shows all of life’s major groups. Figure 5.4
Phylogenetic trees Within the group Animals in the previous slide, one can infer a tree of the major animal groups. Figure 5.4
Phylogenetic trees And within the group Vertebrates in the previous slide, one can infer relationships of the major vertebrate groups, and so on… Figure 5.4
Extinction • Extinction is the disappearance of an entire species from the face of the Earth. • Average time for a species on Earth is ~1–10 million years.Species currently on Earth = the number formed by speciation minus the number removed by extinction.
Extinction • Some species are more vulnerable to extinction than others: • • Species in small populations • • Species adapted to a narrowly specialized resource or way of life • Monteverde’s golden toad was apparently such a specialist, and lived in small numbers in a small area.
Extinction • Some species are more vulnerable to extinction than others: • • Species in small populations • • Species adapted to a narrowly specialized resource or way of life • Monteverde’s golden toad was apparently such a specialist, and lived in small numbers in a small area.
Life’s hierarchy of levels • Life occurs in levels: • from the atom up to • the molecule to • the cell to • the tissues to • the organs to • the organism… Figure 5.7
Life’s hierarchy of levels • … and from the organism to the population to • the community to • the ecosystem to • the biosphere. • Ecology deals with these levels, from the organism up to the biosphere. Figure 5.7
Ecology • The study of: • the distribution and abundance of organisms, • the interactions among them, • and the interactions between organisms and their abiotic environments • Ecology is NOT environmental advocacy! • (= a common MISUSE of the term)
Habitat and niche • Habitat = the specific environment where an organism lives (including living and nonliving elements: rocks, soil, plants, etc.) • Habitat selection = the process by which organisms choose habitats among the options encountered • Niche = an organism’s functional role in a community (feeding, flow of energy and matter, interactions with other organisms, etc.)
Population ecology • Population = a group of individuals of a species that live in a particular area • Several attributes help predict population dynamics (changes in population): • • Population size • • Population density • • Population distribution • • Age structure • • Sex ratio
Population size • Number of individuals present at a given timePopulation size for the golden toad was 1,500+ in 1987, and zero a few years later.
Population density • Number of individuals per unit area or, • Number of individuals per unit volume • Population density for the harlequin frog increased locally as streams dried and frogs clustered in splash zones.
Population distribution • Spatial arrangement of individuals Clumped Random Uniform Figure 5.8
Age structure • Or age distribution = relative numbers of individuals of each age or age class in a population • Age structure diagrams, or age pyramids, show this information. Figure 5.9
Age structure Pyramid weighted toward young: population growing Pyramid weighted toward old: population declining Figure 5.9
Sex ratio • Ratio of males to females in a population • Even ratios (near 50/50) are most common. • Fewer females causes slower population growth. • Note human sex ratio biased toward females at oldest ages.
Population growth Populations grow, shrink, or remain stable, depending on rates of birth, death, immigration, and emigration. (birth rate + immigration rate) – (death rate + emigration rate) = population growth rate
Exponential growth • Unregulated populations increase by exponential growth: • Growth by a fixed percentage, rather than a fixed amount. • Similar to growth of money in a savings account
Exponential growth in a growth curve • Population growth curves show change in population size over time. • Scots pine shows exponential growth Figure 5.10
Limits on growth • Limiting factors restrain exponential population growth, slowing the growth rate down. • Population growth levels off at a carrying capacity—the maximum population size of a given species an environment can sustain. • Initial exponential growth, slowing, and stabilizing at carrying capacity is shown by a logistic growth curve.
Logistic growth curve Figure 5.11
Population growth: Logistic growth • Logistic growth (shown here in yeast from the lab) is only one type of growth curve, however. Figure 5.12a
Population growth: Oscillations • Some populations fluctuate continually above and below carrying capacity, as with this mite. Figure 5.12b