Download
1 / 4
50 likes | 118 Vues
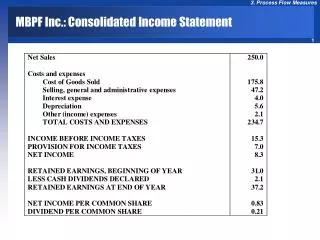
Detailed analysis of consolidated income statement, key financial indicators, and balance sheet for Q1 2003 and Q1 2002 to evaluate changes in sales, profits, expenses, and financial health.

E N D
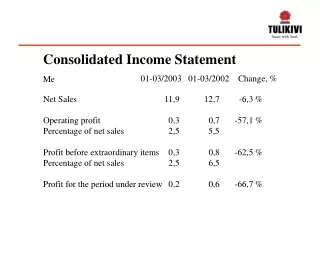
Consolidated Income Statement 01-03/2003 01-03/2002 Change, % Me Net Sales 11,9 12,7 -6,3 % Operating profit 0,3 0,7 -57,1 % Percentage of net sales 2,5 5,5 Profit before extraordinary items 0,3 0,8 -62,5 % Percentage of net sales 2,5 6,5 Profit for the period under review 0,2 0,6 -66,7 %
Consolidated Income Statement 01-03/2003 01-03/2002 Change, % Me Net Sales 11,9 12,7 -6,3 % Change in inventories of finished goods 0,1 0,9 Production for own use 0,2 Other operating income 0,1 0,1 Materials and external changes 3,6 3,9 Personnel expenses 4,6 5,3 Depreciations and value adjustments 0,9 1,0 Other operating expenses 2,7 3,0 Operating profit 0,3 0,7 -57,1 % Percentage of net sales 2,5 5,5 Financial income and expenses 0,1 Profit before extraordinary items 0,3 0,8 -62,5 % Percentage of net sales 2,5 6,5 Income taxes 0,1 0,2 Profit for the period under review 0,2 0,6 -66,7 %
Key Financial Indicators 03/2003 03/2002 Order stock, (31.3), Me 6,9 7,2 Gross investments, Me 0,4 1,7 Gross investments/net sales, % 3,4 13,5 Earning per share, € 0,11 0,34 Equity per share, € 13,32 13,60 Solvency ratio, % 55,6 56,1 Current ratio 1,9 1,3 Average number of shares 1821277 1799724 Number of shares 31 Mars 1821277 1799724
Consolidated Balance Sheet Me Assets 3/2003 3/2002 Fixed assets 20,6 23,4 Current assets Inventories 6,5 7,1 Other current assets 17,0 13,6 Liabilities Shareholders´equity Share capital 6,2 6,2 Other items 18,1 18,6 Liabilities Long-term liabilities 7,4 3,9 Short-term liabilities 12,4 15,4 Balance sheet total 44,1 43,1