Download

1 / 34
370 likes | 698 Vues
Introduction to fMRI for Social Scientists. Melissa A. Robinson Penn State College of Medicine Neuroscience PhD Program. Outline. FMRI vs. other techniques History Biology Physics Designs Data Analysis Example Study. What is fMRI?.

E N D
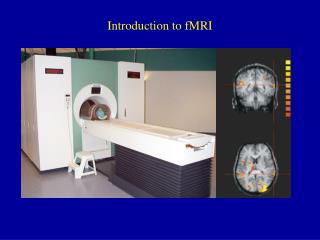
Introduction to fMRI for Social Scientists Melissa A. Robinson Penn State College of Medicine Neuroscience PhD Program
Outline FMRI vs. other techniques History Biology Physics Designs Data Analysis Example Study
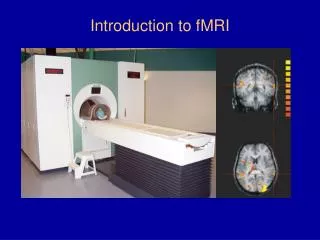
What is fMRI? • Functional Magnetic Resonance Imaging (fMRI): uses MRI to indirectly measure brain activity • MRI focuses on brain anatomy; fMRI focuses on the brain activity • Known for over 100 yrs. that blood flow and blood oxygenation are linked to neural activity– only since the early 1990’s was fMRI developed (Ogawa & Kwong) • Based on the assumption that neuronal activity requires O2 which is carried by the blood; increased blood flow and resulting hemodynamics are foundation to fMRI Source: James Dackner, www.ftcm.org.uk/_borders/MRI_scan2.jpg, www.musictherapyworld.de
Why Use fMRI? • Clinical uses- pre-surgical planning, id’ing brain pathologies, and many future potential uses • Research Purposes- many researchers from several disciplines are using fMRI to better understand brain function in animals and humans Source: http://biologybiozine.com/images, www.kuleuven.ac.be/.../image
Measuring Neural Activity Source: http://www.psych.nyu.edu/pylkkanen/LOT_2005/DAY1/Funct_neuroimaging.pdf
Functional Magnetic Resonance ImagingWhy All The Excitement? Compared to PET and SPECT: • Increased resolution: temporal (100 msecs) & spatial (1-2 mm) • No radiation • Non-invasive • Same subject = repeat multiple times • Performed on modern MRI scanners
History of fMRI • 1946: Block and Purcell discover that nuclei absorb and emit radio frequency--- NMR • 1973: Lauterbur suggests NMR could be used to form images • 1977: clinical MRI patented • 1990: Ogawa observes BOLD effect with T2* • 1992: Ogawa and Kwong publish first functional images using BOLD signal Source: www.ee.duke.edu/.../MRIHomepage
Biological basis • fMRI is dependent on the Blood Oxygen Level Dependent (BOLD) signal • Active-increased oxyhemoglobin: deoxyhemoglobin • Diamagnetic vs. Paramagentic • Differences in magnetic susceptibility can be measured (T2*) Source: fMRIB Brief Introduction to fMRI
Local Consumption of ATP Neural Activity Local Energy Metabolism CMRO2 CMRGlc CBF CBV Biological Basis BOLD signal results from a complicated mixture of these parameters Source: James Danckert, U. Waterloo
Hemodynamic Response • 2-3 second delay for activation • 4-6 seconds for peak • 4-6 seconds to return to baseline • Signal change (condition-baseline) (0.2 -3%)
fMRI equipment • Gradients Coils- smaller magnets used to tip net magnetization of subject (MO) out of alignment w/ BO ; gradients can be applied in the x, y, z planes • RF Coil- used to measure the MO after RF pulse applied • T1 –rate at which the object/person goes from a non-magnetized state to a magnetized state (diff. molecules have diff. rates) measures longitudinal relaxation • Anatomical image • T2 –rate of decay of the MR signal after the RF pulse is delivered; measures the transverse relaxation; overall decay is T2 * (functional imgs.) Longitudinal relaxation Transverse relaxation Source: Center for Disease control and Prevention; www-mrsrl.stanford.edu
VOXEL (Volumetric Pixel) Slice Thickness e.g., 6 mm In-plane resolution e.g., 192 mm / 64 = 3 mm 3 mm 6 mm SAGITTAL SLICE IN-PLANE SLICE 3 mm Number of Slices e.g., 10 Matrix Size e.g., 64 x 64 Field of View (FOV) e.g., 19.2 cm fMRI Parameters TR/TE Source: James Danckert
fMRI Designs and Studies • What are you interested in? Hypothesis? • Subjects and Controls? • Stimuli? • What kind of design will best suit your interest? • Block • Event • Mixed • Parameters for imaging
Block Design • Assume the BOLD effect remains constant • May have habituation effects • Usually better signal strength than other designs • Most common; comparing conditions; differ by one component Source: Buckner 1998
Event- related design • Possible to allow hrf to return to baseline each trial • Usually not habituation effects, but may compromise signal strength/SNR • To increase signal strength, usually have more events • Can randomize • Can help control for individual differences Source: Buckner 1998
Before analyzing data • Have raw data from fMRI, now need to be able to put it into format that we can visualize, analyze, and interpret • K-space (holds raw data before reconstruction; is in the spatial frequency domain) is transformed into images by use of a Fourier transform Source:www.mathworks.com/.../files/1759/mriphantom
Software for fMRI data processing and display • Unix-based shareware • AFNI National Institutes of Health • SPM Wellcome Dept. of Imaging Neuroscience • FSL Analysis Group, FMRIB • VoxBo University of PA • NIS University of Pittsburgh • MRI vendor-specific software • Brainwave GE Medical systems • Advanced Neuro Siemens Medical Systems • IView Phillips Medical Systems • Other • Brain Voyager Brain Innovation B.V. • Med-X Source: Beth Meyerand
Analyzing Data Analysis can be divided into 3 main categories • Spatial processing • Estimating parameters of statistical model • Making inferences about those parameter estimates with appropriate statistics
Spatial Processing Remove unwanted variance in voxel time-series • -Movement • -Shape differences among serial scans • Realignment- correct for head movement • Coregistration- superimpose EPI images on high resolution anatomical image • Normalization- mean image of series conformed to a standard anatomic space (e.g. talairach); controls for individual morphological variations of the brain • Smoothing- smooth images; increase SNR
Estimating Parameters of Statistical Model • SPM uses the Generalized Linear Model (GLM) to make parameter estimates. Y = X . β + ε Design matrix – model formed of several components which explain the observed data Timing information (onset vectors, duration vectors), expected shape of BOLD response Parameters defining the contribution of each component of the design matrix to the model. These are estimated so as to minimize the error, and are used to generate the contrasts between conditions Error - the difference between the observed data and the model defined by Xβ. Observed data – SPM uses a mass univariate approach Source: http://www.fil.ion.ucl.ac.uk/spm/doc/mfd/GLM.ppt
GLM and fMRI Design • For the most part, you are doing a t-test for each voxel comparing the whole time course of the • predicted hemodynamic response to the actual/observed Observed data Model (green and red) and true signal (blue); effects of interest are convolved with hemodynamic (BOLD) response function (HRF), to capture sluggish nature of response • Error + noise – set parameters to • minimize this Source: http://www.fil.ion.ucl.ac.uk/spm/doc/mfd/GLM.ppt; Matthias Moosman
So Far… 1) Data Acquisition 2) Data Processing
Inferences • Activation map • Statistical Tests • one-sample t-test • two-sample t-test • paired t-test • ANOVA • Regressions • Interpretation of results Moral Judgment Avg. Negative age Regression n=9; v=10; p<.01 Moral Judgment Avg. Activation n=9; v=10; p<.01 Source: John Gore, www.olavegeland.com
Advantages and Limitations • Advantages • Non-invasive, no radiation • Spatial resolution • Relatively easy for researchers to use • Limitations • Time resolution- okay (many have started to combine EEG or MEG w/fMRI) • Indirect measure • HRF may also vary between areas, not just subjects • Within subjects, responses are more consistent, although there is still some variability between sessions
Developing Techniques • Conjunction analysis- testing for the effects of a condition in multiple contexts • Connectivity analysis- interconnection between activated brain regions • Psychophysioligic Interaction (PPI)- Specific areas correlated across tasks
Specific Aims • To test the hypothesis that underlying neural substrates are dedicated to the processing of pro-social emotions and that this processing is distinct from anti-social emotion processing. • To differentiate activation patterns between and evaluate level of structure involvement recruited by the pro-social emotions: gratitude, forgiveness, and humility • To investigate subject variability and individual differences by correlating activation patterns with out-of-magnet test scores and ratings.
Research Plan • Participants • Out-of-magnet tests: WAISIII, Scales of Psychological Well-Being, Bar-On EQ-I, PANAS, Stroop Test, stimuli ratings • fMRI • Stimulus sets • 2 runs • Data analysis • SPM2
Stimuli and fMRI Procedures • Stimuli Display Base scenario (12s) + Pro-stimuli (6s for reading +12 second crosshair) + Anti-social stimuli (6s for reading +12 second crosshair) + Baseline stimuli (6s for reading + 12 second crosshair) =66 s X 40 (10/condition- F/I,G/I,H/A, valence) + rests (120s) + intro slides (24 seconds) =2784s = 2 runs, each 23 min 12s • fMRI Procedures • 3T • Functional images will be acquired with an echo planar imaging sequence (TR / TE = 3000 ms / 35 ms, flip angle = 90º, FOV = 23 x 23 cm2, 24 5-mm-thick axial slices with no gap between slices, acquisition matrix = 64 x 64, number of average = 1). randomized randomized
Links • Basic fMRI background, design, and methodology: -www.fmrib.ox.ac.uk/education/fmri/introduction-to-fmri -www.arts.uwaterloo.ca/~jdancker/fMRI/fMRI_OL.htm -http://psychology.uwo.ca/fmri4newbies/ -http://www.indiana.edu/~panlab/fmriDocs/studyDesign.pdf -Functional MRI: An Introduction to Methods. Edited by Peter Jezzard, Paul M.Matthews, and Stephen M. Smith. Oxford, England: Oxford University Press 2001 • Software: -SPM link: http://www.fil.ion.ucl.ac.uk/spm/ -AFNI link: http://afni.nimh.nih.gov/afni/
Acknowledgements • Dr. Paul Eslinger, Neurology • Dr. Jian Li Wang, Radiology • Dr. Qing Yang, Radiology • Dr. Burt Monroe, QuaSSI director • Dr. Jeff Lourberbaum, Psychiatry • NMR Center Lab