Download
1 / 4
50 likes | 171 Vues
Image Techniques. http://en.wikipedia.org/wiki/Confocal_laser_scanning_microscopy.

E N D
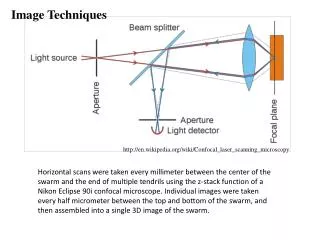
Image Techniques http://en.wikipedia.org/wiki/Confocal_laser_scanning_microscopy Horizontal scans were taken every millimeter between the center of the swarm and the end of multiple tendrils using the z-stack function of a Nikon Eclipse 90i confocal microscope. Individual images were taken every half micrometer between the top and bottom of the swarm, and then assembled into a single 3D image of the swarm.
Orientation Correlation Calculation of orientation correlation of P. aeruginosa cells at the swarm edge and in the internal wave. Experimental images show one representative horizontal plane acquired using confocal microscopy to obtain multiple planes (in the z-direction) of green fluorescent protein-labeled cells. (A) Cells are closely packed and form rafts in a tendril at the swarm edge. The tendrilis divided into four regions (as marked in the figure). We compute orientation correlation for each region. (B) Orientation correlations for each region indicated by green-dotted, cyan-dotted, purple-dotted and blue-dotted lines respectively and red-dotted line for the region of the wave of high cell density. Calculation of orientation correlations reveals that cells in the tendril show strong alignment with each other while cells in the wave of high cell density display random orientation with respect to each other. (C) Patterning of cells within one plane within the cell wave. Cells also form rafts. Although cells in the wave of high cell density show certain alignment with neighboring cells, cells at some distance show from each other display random orientation.
(A) Positions of the internal wave (IW) and of the swarm edge (SE) on soft agar as a function of time. Speeds of SE expansion are 0.05cm/h and 0.18cm/h in experiments (black line) and simulation (light blue dashed line) respectively. Speeds of IW propagation are 0.08cm/h and 0.24cm/h in experiments (purple line) and simulation (dark blue line) respectively. (B) Non-dimensional bacterial density as a function of time. IW corresponds to the internal wave, and SE corresponds to the density near the swarm edge.
Comparison of swarm areas as functions of time obtained in experiments and simulations. Black and blue lines indicate model predictions for soft and hard agar cases respectively. Triangles represent data for swarming on hard agar plates. Experimental data for swarming on soft agar plates represented by diamonds agrees well the simulated data represented by black line. Experimental data (triangles) and simulated data (blue line) also agree well each other.