Download

1 / 105
1.13k likes | 1.67k Vues
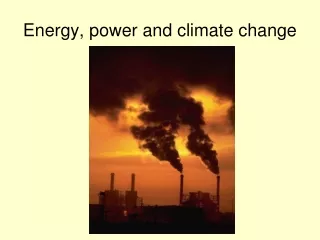
Climate Change and Energy. Updated PowerPoint show about climate change and energy sector. Research results of climate change. Source: National Geographic. Global warming is due to strengthened greenhouse effect.

E N D
Climate Change and Energy Updated PowerPoint show about climate change and energy sector
Source: National Geographic Global warming is due to strengthened greenhouse effect The Earth has a natural temperature control system. Certain atmospheric gases are critical to this system and are known as greenhouse gases. On average, about one third of the solar radiation that hits the earth is reflected back to space. The Earth's surface becomes warm and as a result emits infrared radiation. The greenhouse gases trap the infrared radiation, thus warming the atmosphere. Naturally occurring greenhouse gases create a natural greenhouse effect. However, human activities are causing greenhouse gas levels in the atmosphere to increase. Greenhouse effect
Earth’s energy budget Source: Nasa, Atmospheric Science Data Center
Strengthening of greenhouse effect is due to increase of greenhouse gases in the atmosphere The six greenhouse gases under the Kyoto Protocol: • Carbon dioxide orCO2 • Methane orCH4 • Nitrous oxide or N2O • Perfluorocarbons or PFC compounds • Hydrofluorocarbons orHFC compounds • Sulphur hexafluoride or SF6 Other greenhouse gases: • Ozone orO3 • Brominecompounds or halogens, e.g. CF3Br • Freons or chlorofluorocarbons orCFC:s • Water vapour or H2O (g) • Global atmospheric concentrations of greenhouse gases have increased markedly as a result of human activities! Source: IPCC Fourth Assessment Report
Different greenhouse gases have different meaning to global warming Source: IPCC Fourth Assessment Report
Meaning of carbon dioxide to global warming • Carbon dioxide is the most important anthropogenic greenhouse gas. • The primary source of the increased atmospheric concentration of carbon dioxide results from fossil fuel use in power and heat production as well as transport. • The change of land use provides another significant but smaller contribution. • The atmospheric concentration of carbon dioxide exceeds by far the natural range over the last 650,000 years. Source: IPCC Fourth Assessment Report
Industry Sources of EU-27 greenhouse gas emissions Industry
The global atmospheric concentration of greenhouse gases has increased
Atmospheric concentration of greenhouse gases correlates with temperature
According to researches earth’s mean temperature has risen in the 20th and the 21st century Source: IPCC Fourth Assessment Report
Different reconstructions of mean temperature have been published by researchers
Change in volume of glaciers Cumulative Change in Volume of Arctic Glaciers since 1960
The average temperature is rising but our choices make a difference Multi-model averages and assessed ranges for surface warming Source: IPCC Fourth Assessment Report
Effects of climate change Source: IPCC Fourth Assessment Report
Examples of major projected impacts on agriculture, forestry and ecosystems Virtually certain (>99%) is, that • Increased yields in colder environments; decreased yields in warmer environments • Increased insect outbreaks Very likely (90-99%) is, that • Increased danger of wildfire. • Damage to crops, soil erosion and inability to cultivate land due to heavy precipitation events Likely (66-90%) is, that • Intense tropical cyclone activity increases damage to trees, crops and coral reefs • Salinisation of freshwater systems due to high sea level Source: IPCC Fourth Assessment Report
Examples of major projected impacts on water resources Virtually certain (>99%) is, that • Effects on water resources relying on snow melt and some water supplies Very likely (90-99%) is, that • Water quality problems, e.g., algal blooms • Adverse effects on quality of surface and groundwater; contamination of water supply; water scarcity may be relieved Likely (66-90%) is, that • More widespread water stress • Power outages causing disruption of public water supply • Decreased freshwater availability due to saltwater intrusion Source: IPCC Fourth Assessment Report
Examples of major projected impacts on human health Virtually certain (>99%) is, that • Reduced human mortality from decreased cold exposure Very likely (90-99%) is, that • Increased risk of heat-related mortality • Increased risk of deaths, injuries and infectious, respiratory and skin diseases Likely (66-90%) is, that • Increased risk of malnutrition and water- and food borne diseases • Intense tropical cyclone activity and floods increase risk of deaths, injuries and diseases Source: IPCC Fourth Assessment Report
Examples of major projected impacts on industry, settlement and society 1/2 Virtually certain (>99%) is, that • Reduced energy demand for heating • Increased demand for cooling • Declining air quality in cities • Reduced disruption to transport due to snow and ice • Effects on winter tourism Source: IPCC Fourth Assessment Report
Examples of major projected impacts on industry, settlement and society 2/2 Very likely (90-99%) is, that • Reduction in quality of life for people in warm areas without appropriate housing • Disruption of settlements, commerce, transport and societies due to flooding Likely (66-90%) is, that • Water shortages for settlements, industry and societies • Disruption by flood and high winds • Costs of coastal protection versus costs of land-use relocation; potential for movement of populations and infrastructure Source: IPCC Fourth Assessment Report
Impacts of climate change in Finland • Climate will warm up in the Nordic countries and Arctic region especially in winter • Winter season will become shorter and days with snow cover will became less usual • Period of growth will become longer • Precipitation will increase specially in winter, but not necessarily in summer • Frequency of heavy precipitation events increases in every season • Coniferous forest zone moves north Source: www.ilmastonmuutos.info, www.ilmasto.org
Total energy consumption has increased substantially in Finland *Tähän diaan on liitettynä muistiinpanoja
Electricity consumption has increased even more than energy consumption
Electricity consumption by sector in Finland 2007 (90,3 TWh)
Electricity supply by energy sources in Finland 2007(90,3 TWh)
Fuel consumption in production of district heat and CHP in Finland 2007
Fuel consumption in production of district heat and CHP in Finland 1976-2007
Fuel shares of district heating and CHP in different areas of Finland year 2007
* Pumped Storage Plants and Other Power Stations Source: Eurostat , European Commission Gross electricity generation by Fuel – EU-27 2005
Increasing of electricity generation has been even faster than world’s total primary energy supply
Evolution from 1971 to 2005 of world’s electricity generation by regions (TWh)