Download
1 / 37
370 likes | 602 Vues
Evolution of Lattice Properties. B. Rouben McMaster University EP 4D03/6D03 Nuclear Reactor Analysis 2008 Sept-Dec. Contents. We study the evolution of nuclear properties with irradiation or burnup in CANDU reactors. Fuel Depletion.

E N D
Evolution of Lattice Properties B. Rouben McMaster University EP 4D03/6D03 Nuclear Reactor Analysis 2008 Sept-Dec
Contents • We study the evolution of nuclear properties with irradiation or burnup in CANDU reactors .
Fuel Depletion • When nuclear fuel is “burned” in a reactor, changes occur in the fuel. These changes go under the general name of “ fuel (isotopic) depletion”. • Here we shall look at the changes which happen in the standard CANDU lattice, and at the quantitative changes in the reactivity and other nuclear properties of the lattice. • Although we are looking specifically at the standard CANDU, a similar analysis needs to be done for any reactor which needs to be studied.
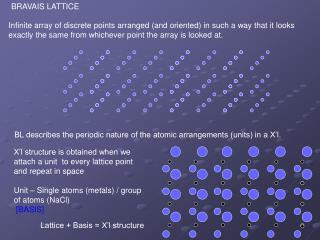
Changes in Fuel with Irradiation/Burnup The following changes occur cumulatively in CANDU nuclear fuel with time: • The U-235 depletes (i.e., its concentration, which starts at 0.72 atom% for fresh natural uranium, decreases) • Fission products accumulate; most of these are radioactive, and many have a significant neutron-absorption cross section • Pu-239 is produced via neutron absorption in U-238 and two beta decays: 238U + n 239U* 239Np + 239Np 239Pu +
Changes in Fuel with Irradiation/Burnup (cont.) • Pu-239 participates in the fission chain reaction while it keeps being created at about the same rate from U-238, its net rate of increase slows. • Further neutron absorptions lead from Pu-239 to Pu-240 (non-fissile), then Pu-241 (fissile) • Other higher actinides are also formed (e.g., curium, americium) • The total fissile fraction in the fuel (U-235+Pu-239+Pu-241) decreases monotonically.
Fuel Irradiation and Burnup • Two new reactor-physics concepts, on which we have not really focused up to now, have to do with the evolution in time of the fuel. • These 2 concepts are those of fuel irradiation and burnup, and are very important. • These concepts are related because, in a way, they are both a measure of the “age” of the fuel in the reactor.
Fuel Irradiation • Fuel irradiation, usually denoted , is the product of flux and time; or, more precisely, the integral of neutron flux with time: • Therefore fuel irradiation starts at 0 when fresh fuel enters the reactor, and cumulates with time, depending on the magnitude of the neutron flux. • From Eq. (1), we can see that the units of irradiation are those of flux times time, e.g., (n.cm-2.s-2)*s n.cm-2 [ n/cm2]. • Because there can be many different fluxes (e.g., thermal flux, fast-neutron flux, total flux, etc.), the concept of irradiation is not absolute, but depends on the definition of the flux. • Irradiation is also called exposure or fluence.
Fuel Burnup • The concept of fuel burnup bears an inappropriate name, because it does not have to do directly with the “burning up” of the fuel. • Fuel burnup is defined as the fission energy produced by the fuel since its entry into the reactor per unit mass of uraniumin the (original) fuel (or of heavy element, if the original fuel contains other fissionable elements). • Since the fuel keeps releasing fission energy with time, it is clear that fuel burnup is also a measure of the “age” of the fuel in the reactor. Just like irradiation, fuel burnup starts at 0 and cumulates with time, depending on its power level. • Fuel burnup is reported in units such as MW.d/Mg(U) or MW.h/kg(U). • Because energy is an absolute quantity (as opposed to flux), fuel burnup does not depend on the definition of the neutron flux.
Interactive Discussion/Exercise • If the fuel burnup is 180 MW.h/kg(U), what is it in the units of MW.d/Mg(U)? • What is it in kW.d/kg(U)? • If you are confused in a computation, and use electric energy instead of fission energy in calculating fuel burnup, how far (by what factor) off will you be?
Evolution of Isotopic Densities of Fuel Nuclides Note: The irradiation scale is that of the POWDERPUFS-V Code
Relationship Between Irradiation and Burnup Note: Irradiation scale is that of POWDERPUFS-V
Infinite Lattice CANDU basic cell Lattice (or cell) codes also calculate the nuclear properties (including the reactivity) of the infinite lattice, which consists of an infinite array of identical cells in all directions. POWDERPUFS-V is a lattice code for CANDU.
Reactivity of Infinite Lattice Note: Irradiation scale is that of POWDERPUFS-V
Reactivity of Infinite Lattice The following should be noted from the graph of versus irradiation: • The fresh-fuel infinite lattice (0 irradiation) has a very high reactivity (~76 mk) • The reactivity starts to decrease immediately, on account of U-235 depletion • It then starts to increase for a while, on account of the production of Pu-239, which is slightly more effective than U-235. Note the slight delay, due to the Np-239 ~2-day half-life. • However the rate of increase of reactivity slows (because the net rate of plutonium production decreases), and the reactivity comes to a maximum at an irradiation of ~0.3 n/kb. This is called the plutonium peak (note: it’s not a peak in Pu, but in reactivity!) • Following the plutonium peak, the reactivity decreases monotonically, on account of the continuing depletion of U-235 and the continuing accumulation of fission products. cont’d
Saturating Fission Products • Note that some of the fission products are called “saturating fission products” (sfp). • This label is used because the concentration of these fission products does not keep increasing, but instead comes (relatively) quickly to an equilibrium value as long as the power is constant; i.e., the rate of production of the sfp is equal to its decay. • Note however that the sfp’s concentration may vary very significantly following changes in power! • The most important sfp is 135Xe, because it has a very high absorption cross section; it contributes ~ -28 mk in CANDU at full power. Other sfps (of secondary importance) are 149Sm, 151Sm, and isotopes of Rh, Gd, and Eu.
Neutron Balance in CANDU–6 Equilibrium Core • It is instructive to quantify the various events in the neutron cycle taking place in the nuclear lattice. • The figure in the next slide gives the approximate rates of production and absorption of neutrons via various pathways in the “equilibrium, or time-average” CANDU-6 reactor core (normalized to an arbitrary 1000 fission neutrons born).
Production 56.5 Neutrons From U238 Fast Fission 491.9 Neutrons From U235 Thermal Fission 438.4 Neutrons From Pu239 Thermal Fission 13.2 Neutrons From Pu241 Thermal Fission Total = 1000 Neutrons Fast Leakage Fast Absorp. In Fuel 6.0 Neutrons 31.7 Neutrons Resonance Absorp. in U238 Slowing Down 89.4 Neutrons Thermal Leakage Thermal Absorption 23.0 Neutrons 849.9 Neutrons Thermal Absorp. In Fuel Thermal Absorption In Non Fuel Components 242.5 Neutrons In U235 14.4 Neutrons In Moderator 238.2 Neutrons In U238 0.3 Neutrons In Coolant 228.1 Neutrons In Pu239 19.0 Neutrons In PT 15.6 Neutrons In Pu240 8.5 Neutrons In CT 6.2 Neutrons In Pu241 6.2 Neutrons In Sheath 0.1 Neutrons In Pu242 15.0 Neutrons In Adjusters 0.6 Neutrons In Np Zone Controllers and 7.7 Neutrons In Sm" Parasitic Absorbers 25.2 Neutrons In Xe 2.6 Neutrons In Rh" Total = 63.4 Neutrons Notes: 19.9 Neutrons In PFP Fast group denotes 10 MeV > E > 100 keV Total = 786.5 Neutrons Resonance group denotes 100 keV > E > 10 eV Thermal group denotes sum of Thermal group E < 0.625 eV and Epithermal group 10 eV > E > 0.625 eV Neutron Balance in the CANDU-6 Equilibrium Core
Interactive Discussion/Exercise • What fraction of neutrons suffer absorption in U-238 in the resonance region? • What total fraction of neutrons is absorbed in U-238? How does the absorption in the heavy-water moderator compare to this? • What fraction of fissions are induced by fast neutrons? • What fraction of fission neutrons originate in plutonium fissions? • What is the total leakage (in % or mk)? • Do not turn the page until you have attempted/done this discussion/exercise.
Neutron-Cycle Statistics • ~8.5% of neutrons are absorbed in U-238 resonances • ~35% of neutrons are absorbed in U-238; this is about 6 times as many as the absorptions in the heavy-water moderator. [Most of the absorptions in U-238 lead to the production of Pu-239] • Only ~5% of fissions are induced by fast neutrons • ~45% of fission neutrons originate in plutonium fissions (and therefore plutonium is the source of ~45% of the energy released over the lifetime of the fuel) • The total leakage of neutrons is ~3% (i.e., -30 mk).
Back to Reactivity of Infinite Lattice ) On the reactivity curve several slides back, note also: • When all fuel is fresh, a significant amount of negative reactivity must be added to the lattice to suppress the initial supercriticality. • The infinite lattice reaches zero reactivity at an irradiation of ~1.6 n/kb, corresponding to a burnup of ~ 6,700 MW.d/Mg(U). • A homogeneous infinite lattice with fuel beyond that burnup would be subcritical. • However, remember that the infinite lattice does not have leakage; also, it does not account for neutron absorption in all the reactivity devices within the core. • Consequently, a homogeneous reactor with all fuel at the same irradiation would reach zero reactivity at a much lower burnup.
The Yield and Thermal Absorption Cross Sections • The two cross sections which vary most with irradiation, and therefore give the reactivity curve its shape, are the yield cross section (f2) and the thermal absorption cross section (a2):
Other Cross Sections (Almost Constant) • The downscattering cross section and the fast absorption cross section are almost constant with irradiation (because the U-238 and D2O concentrations are almost unchanged). Therefore they do not contribute to the reactivity curve’s shape:
Reactivity effof Homogeneous Finite Reactor In the CANDU-6 reactor: • Leakage is about -30 mk. • The average reactivity-device load is ~ -18 mk. • Therefore we can get an estimate of the reactivity of a homogeneous CANDU-6 reactor by subtracting 48 mk from the reactivity of the infinite lattice. • This subtraction gives the curve in the next slide.
Reactivity effof “Homogeneous” CANDU-6 Reactor Note: Irradiation scale is that of POWDERPUFS-V
Reactivity effof “Homogeneous” CANDU-6 Reactor Note also: • When all fuel is fresh, we need to add a significant amount of negative reactivity to the reactor to suppress the initial supercriticality. • It looks as if the homogeneous CANDU-6 would reach zero reactivity at an irradiation of ~1.0 n/kb, corresponding to a burnup of ~ 4,000 MW.d/Mg(U). • A homogeneous CANDU-6 with fuel beyond that burnup would be subcritical.
The “Real” CANDU-6 Reactor Note however: • Real reactors are not homogeneous, except at the very start of life – because the neutron flux varies with position, and so the fuel at different positions in core cumulates burnup at different rates. • In addition, CANDU reactors are refuelled on-line, so there is always (except near start of life) a mixture of fresh fuel and fuel with high irradiation. • The fuel with high irradiation has negative “local” reactivity, but this is compensated by the positive local reactivity of young fuel. • The proper mixture of fuel in this inhomogeneous reactor (i.e., the rate of refuelling) gives a critical reactor! cont’d
Interactive Discussion/Exercise • How would you estimate the maximum fuel burnup in a mixture of burnups that would give a critical reactor? • Explain. • Do not turn the page until you have attempted/done this discussion/exercise.
The “Real” CANDU-6 Reactor (cont’d) • The mixture of new and old fuel allows us to drive the discharge irradiation (and therefore, burnup) to a much higher value than might be guessed from the “homogeneous” reactivity curve of 3 slides back (i.e., much higher than ~1.0 n/kb) • We can guess (or calculate) approximately how far we can drive the exit irradiation by determining what value of irradiation gives equal “positive” and “negative” areas “under” the irradiation curve [this tells us where the average eff would be 0].
The “Real” CANDU-6 Reactor (cont’d) Mixture of fuel with on-line refuelling
The “Real” CANDU-6 Reactor (cont’d) • From the figure we see that positive and negative areas are equal when the fuel goes to an irradiation of ~1.8 n/kb. This is then the average exit irradiation to which we can take the fuel because we are refuelling the reactor on an on-going basis. This corresponds to an average exit burnup of ~7,500 MW.d/Mg(U). • The average discharge irradiation and burnup are almost twice (!!) the values (1.0 n/kb and 4,000 MW.d/Mg(U)) that we could expect if we “batch-refuelled” the reactor, i.e., if we put all the fuel in at once.
The Reactivity Curve • The reactivity curve which we plotted in the last few slides is a typical one for a standard CANDU lattice. • But the actual values on the curve are affected by design and operational parameters – these parameters can move the curve up or down with respect to the horizontal axis. • If the curve is moved up, it will cross the horizontal axis further to the right, and the positive area under the curve will increase. Then we can take the fuel to a higher exit burnup (i.e., we’ll have to go further to the right to get a “negative” area equal to the positive area). • And the opposite if the curve is moved down. cont’d
Interactive Discussion/Exercise • Name as many factors which can drive the reactivity curve up or down as you can. • Which of these must be decided upon when the reactor is designed, and which ones can be manipulated as the reactor is operated? • Do not turn the page until you have attempted/done this discussion/exercise.
What Can Move the Reactivity Curve or ? Some examples (“design” or “operation”): • The purity of the heavy-water moderator (operation) • The thickness of the pressure tubes (design) • The number and “strength” (reactivity worth) of control rods (design) • The concentration of moderator poison (operation) • The size of the lattice pitch (design) • The size of the reactor – related to leakage (design) • The presence of a reflector (design) • The purity of the coolant (design) • The exact design of the fuel, e.g., fuel enrichment (operation)