Download
1 / 20
200 likes | 480 Vues
The stakes of Development : from development to sustainable development. F rom development to sustainable development. Introduction The world population today totals 7 Billion inhabitants , twice as many as in 1960

E N D
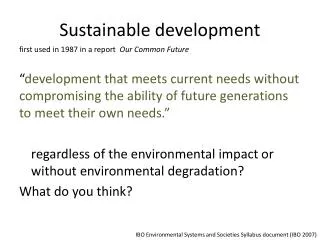
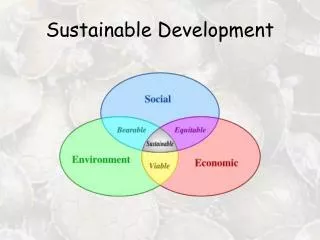
The stakes of Development: fromdevelopment to sustainabledevelopment
Fromdevelopment to sustainabledevelopment Introduction • The world population todaytotals 7 Billion inhabitants, twice as many as in 1960 • There have never been as manywealthy, healthy, educated people but there has alsonever been as muchpoverty, disease and hunger • This canbeexplained by gaps betweenlevels of development • Inequalitiesdefine the world in whichwe live
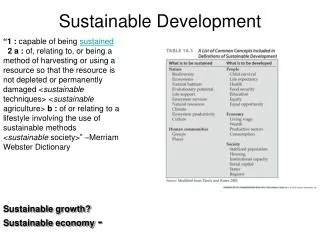
Basic Facts about World Population • The global distribution of population Population distribution is a spatial termwhichdescribes the arrangement or spread of the population over an area. World population distribution isuneven. Places which are sparselypopulatedcontain few people. Places which are denselypopulatedcontainmany people. Sparselypopulated places tend to bedifficult places to live. These are usually places withhostileenvironmentse.g. Antarctica. Places which are denselypopulated are habitableenvironmentse.g. Europe.
Population Density Population densityis a value whichindicates the number of people living in a given area of land. It is an averagenumber. Population densityiscalculated by dividing the number of people by area. Population densityisusuallyshown as the number of people per square kilometer.
Document 1: Whatkind of document isit? Whatis the spacerepresented? What information canbefound in itskey? Q2: How canyouqualify the world population distribution? Q3: Where are the areas of high population which are denselypopulated? Q4: Where are the areas of low population, which are sparselypopulated? Q5: Whatcanexplain the uneven distribution of the world population?
Factorsinfluencing global population distribution: • Physical: climate, relief, soil, vegetation • Human: economicactivities, humanresources, naturalresources, historicalfactors
Fromdevelopment to sustainabledevelopment • Unit Questions: • Whatinequalitiescharacterize the modern world? • Whatwillbe the needs of the 9 Billion inhabitants in 2050? • Is sustainabledevelopment possible?
1. Inequalities and the Modern World • Map 1: Wealth and Poverty Development countries in the north have a high GNI (GNP) from $8,600 to $30,000 per capita However, poor countries in the south have a low GNI, rangingfromlessthan $1,000 to $8,600 per capita. In subsaharianAfrica and southeast and central Asia, 70 -74% of the population liveswithlessthan $2/day Key Word: Gross National Product: The total value of goods and services produced within a country
World map for the year 2007, shaded by gross national income (PPP) per capita. Source: World Bank.Which countries are the wealthiest? The poorest? Map 1 Wealth and Poverty
Inequalities in wealth and development on everyscale A. How canwemeasurewealth and development? 1. Wealth Map1: Wealth and Poverty in the world: thematicplanisphere, colorcoding and various graphs, criteriaused: GNP (PPP)
GNI: Gross National Income : (previously known as Gross National Product-GNP). The total value of goods and services produced within a country together with the balance of income and payments from or to other countries the instrument used to measure the level of production in a country using the addition of the value of the goods and services produced in one year, divided by the number of inhabitants. The GNI in PPP (Purchasing Power Parity) is an indicator of the standard of living.
Whatdoes the map show? The GNI and GNP iscriticized as an indicator of developmentbecauseitdoes not takeintoaccount social factors In 1990, the UN implentedanotherindicator in order to measuredevelopmentlevels
Development: HDI (HumanDevelopmentIndicator) iscalculated by the per capita revenue ($/year), life expectancy per capita, literacy rates of adults and educational rates of childrenunder 15 The value isexpressedfrom 0 to 1
Maps 2 & 3: HDI • ThematicPlanisphere • Gap betweenNorth and South • Countries whose HDI isgreaterthan 0.9 are located in the northwhilethosewhose HDI islowerthan 0.5 canbefound in the south
B. To whatextentisdevelopmentunequal? 1. On a world scale: Long-standing development in the North, recent in the south • Even if itisconstantlyevolving, a line separates the Northfrom the South (Map 3)
The North • In the North, development dates back to the 18th century (demographicgrowth, industrialization and urbanization in Europe, NorthAmerica and Japan) and the Triaddominates (more than 70% of the planetary production of wealth, 80% of trade and new scientificdiscoveries)
The South • With more than 80% of the world’sinhabitants, the South produceslessthan 30% of itswealth. • Even if localized areas of developmentbegan in the 30’s, itdid not generalizeuntil the 60’s. • Demographicexplosion has slowed down development in the south (population has increased 3.5 times since 1950) • Certain emerging countries in the southnowcompeteagainst the north (BRICS countries: Brazil, Russia, India, China, South Africaetc…)
2. On a Regional Scale: • In the North: contrast between Northern and Western Europe vs. Southern and Eastern Europe • In the South: even greater contrast between regional areas - Eastern Africa and Central America, poorest area - Great heterogeneity between emerging powers (BRICS), intermediary developing countries (baby tigers like Indonesia) and LEDCs (Less Economically Developed Countries)