Download
1 / 23
260 likes | 605 Vues
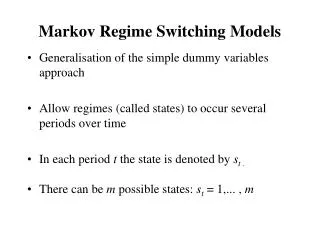
Markov Chain - Brand Switching. AusKola The Aussie Drink. Presented by:. Rita Hsu Kong Mak. Objective. Promoting the idea of: teaching Markov chain modelling by using “spread sheet†(Mathematics C, Senior Syllabus 2001, Page 27-29). The story.

E N D
Markov Chain - Brand Switching AusKola The Aussie Drink
Presented by: • Rita Hsu • Kong Mak
Objective Promoting the idea of: teaching Markov chain modelling by using “spread sheet” (Mathematics C, Senior Syllabus 2001, Page 27-29)
The story • Recently in Australia, a soft drink company, Aussie Soft Drink Company (ASDC) launched a new product called “AusKola.” The company was targeting two very famous international soft drinks: the “Cota-Cola” and “Pets-Cola”. A month After launching the “AusKola”, ASDC has come to the point of doing one of the pre-determined market reviews.
The first Survey • They had previously fixed a number of checkpoints (reviews) at various intervals after the new product was launched. From these reviews they prepared different strategies to deal with different situations, for example, on target, or below target etc. • The first market survey was amazing, AusKola was performing much better than expected.
Better than expected • ASDC was aiming at 18% of the market share at this stage and 1/3 of the market share in the long run. The first survey, just completed, showed that the new AusKola gained 25% of the market share, which is 7% higher than the expected 18%.
Why they succeeded • They attributed their success to: • accurate market research; • correct ingredients (no caffeine); • good flavour; • creative packaging design; • good brand name; • correct promotional strategies.
Stock investment strategies • As a result of the finding, ASDC’s stock price increased by 15%. • Because of the excellent result, ASDC’s financial department is considering how many stock shares of its own company they need to retain, giving the company the most optimistic benefit.
How to keep the momentum • ASDC’s Marketing Department wanted to keep consumers buying the product after they have tested it for the first time. If they were able to predict the future market share of “AusKola” then they would know whether or not they required to: • change the ingredients; • change the flavour; • change the packaging; • change the price; or • change the promotional strategies.
Switching Patterns • Along with the first market survey, ASDC also collected statistics on consumers’ loyalty. For an interval of one week, the possibility of a consumer switching from Cata-Cola to Pets-Cola and AusKola are 0.2 and 0.1 respectively. A regular Pets-Cola consumer may change to Cota-Cola and AusKola at a rate of 0.15 and 0.25 respectively. Similarly, the probability of changing from AusKola to Cota-Cola or Pets-Cola are 0.1 and 0.25. These figures are based on the assumption that, on average, 1 purchase is made each week.
Predicting the market share trend • The Marketing Manager at ASDC is now asking the Technical Department to predict the market share of the three brands in the future. The performances of the two rival brands are important, because ASDC is considering whether they should be attacking the stronger one or weaker one.
What needs to be predicted • The Marketing Manager needs the Technology Department to: • predict the distribution of the share of the market in 6 weeks; • predict the long term market share of each of the brands; and • find when a stable market share will occur.
Current Market Share • Market Share • Cota-Cola 45 % • Pets-Cola 30 % • AusKola 25 %
What is a Markov Chain? • “In some probability situations, the same conditions are repeated, but the probabilities depend on the outcome of the previous trial. This leads to a chain of events that is called a Markov Chain” (Brodie & Swift, 1995, p.100). Brodie, R. & Swift, S. (1995). Q Maths 11c. South Melbourne: Moreton Bay Publishing.
What is a Stochastic Process • If the state of a system can change in some probabilistic fashion at fixed or random intervals of time, we can call the process a stochastic process. • Markov chain is a stochastic process
Transition Matrix • A Transition Matrix is a set of probabilities of a set of states (columns) changing to the next set of states (rows).
State Matrix (or state vector) • Multiplying a “state matrix” by the “transition matrix” gives the probability of each outcome.
Steady State Matrix • A Steady State Matrix is the set of probabilities that converges. • [next steady stateMatrix] = [initial steady stateMatrix] * [transitionmatrix] • or, S(1) = S(0) * T
Counter Attacks • In response to AusKola’s recent success, Cota-Cola and Pets-Cola have created new promotional strategies. AusKola has detected that many consumers have made a change. The recent brand switching pattern has changed.
The prediction • You are assigned to: • predict the distribution of their share of the market in 6 weeks; • predict the long term market share of each of the brands; and • find when the steady state of market share will occur.
Recent Brand Switching Pattern • From To Brand % Market Share • Brand Cota-Cola Pets-ColaAusKola • Cota-Cola 65 20 15 • Pets-Cola 15 65 20 • AusKola 5 25 70 • You may assume last steady state of the market share.
Conclusion • This topic is suitable and in accordance with the syllabus • Spread sheet is a common software • Easier operation in spread sheet than using a calculator • Changing decimals places of accuracy • Better visualization in comparison to graphics calculators • Easier for data input