Download
1 / 24
250 likes | 344 Vues
Explore technology adoption among lower-income populations based on Pew Research Center's data and insights presented by Aaron Smith at APHSA-ISM Annual Conference on October 8, 2013. Learn about internet use, broadband adoption, mobile device trends, and the impact on different age and income groups. Discover the importance of libraries in providing free internet access and how smartphones are changing the landscape of online connectivity, especially for younger adults. Stay informed on the latest updates and resources in the digital technology sphere.

E N D
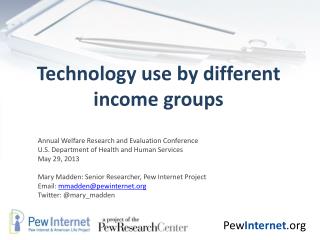
Technology adoption by lower income populations APHSA-ISM Annual Conference October 8, 2013 Aaron Smith, Senior Researcher Pew Research Center
About Pew Internet • Part of the Pew Research Center, a non-partisan “fact tank” in Washington, DC • Studies how people use digital technologies • Does not promote specific technologies or make policy recommendations • Research is primarily based on nationally representative telephone surveys
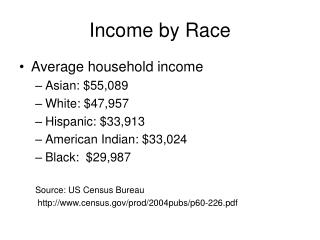
What do we mean by “lower income”? • Based on reported annual household income • Categories collected: <10k, 10-20k, 20-30k, 30-40k, 40-50k, 50-75k, 75-100k, 100-150k, and 150k+ • Around 10-20% of respondents typically don’t report (or don’t know) income • Limited ability to subdivide the lower-income population. But it tends to skew towards non-white; youth and seniors; low education; urban/rural
Before we get started • Apologies for making you start your morning with charts… • But you don’t have to write anything down! • Because you can find these slides at pewinternet.org/presentations
National averages • 85% of American adults are internet users • 70% of American adults have some sort of high-speed home internet connection (DSL, cable, FIOS, etc) Which means that… • 15% of Americans do not go online from any device/location (Group 1) • 15% of Americans go online, but do not have broadband at home (Group 2)
1 2 Internet use & broadband by income
In plain English… • Around 1/3 of people making <$20k per year are not online at all. Non-users are heavily dominated by older adults. • Around 1/3 go online, but don’t have broadband at home. • So how is that group accessing online content?
Many of them turn to public institutions like libraries • 32% of lower-income (<$30k per year) Americans have accessed the internet for free from somewhere other than home, school or work in last 12 months • 81% of lower-income Americans say it is “very important”for the library to provide free access to the internet & computers • 35% of lower-income library users have used the internet or a computer at a library in the last 12 months
Cell ownership > internet use +17 +13
…but especially your age Smartphone ownership by age/income grouping
Smartphone ownership over time +14 +23 +23 +14 +10 +23 +20 +25 +8
Impact of smartphones on “broadband” adoption +14 +12 +14
Biggest impact is among young and working-age lower income adults Broadband/smartphone adoption among HH income of <$30k per year +18 +19 +8
Almost everyone texts, apps track with smartphone ownership % of cell owners in each income group who…
Texting and apps by lower-income adults of different age groups Texting/apps use among cell owners with HH income of <$30k per year
Internet use on cell phones % of cell owners in each income group who use the internet/email on their cell phone 45% of cell internet users in this income group go online mostly with their cell phone 27% 39% 30%
Tablets – growing at the low end, but still largely an elite device Tablet ownership by income category
Summary • Huge differences between young and old lower-income adults • Cell phones are common for all income ranges, but smartphones are mainly a young/working age phenomenon • Many lower-income adults (esp. younger ones) are using mobile devices as their primary gateway to online life
Resources 2013 Broadband update: http://pewinternet.org/Reports/2013/Broadband.aspx 2013 Smartphone update: http://pewinternet.org/Reports/2013/Smartphone-Ownership-2013.aspx Mobile topics page (running list of latest and greatest): http://pewinternet.org/topics/Mobile.aspx
Aaron Smith Senior Researcher Pew Research Center’s Internet Project asmith@pewresearch.org @pewinternet @pewresearch