Describing motion with Graphs
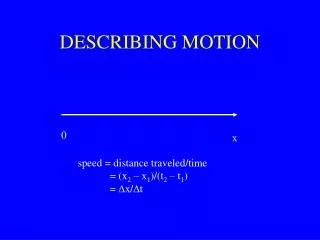
Describing motion with Graphs. Position vs. Time Graphs. x-axis: Time y-axis: Position slope = velocity (slope = “rise” / “run”) horizontal line: at rest straight line: constant velocity positive slope = positive velocity negative slope = negative velocity curved line: acceleration.


Describing motion with Graphs
E N D
Presentation Transcript
Position vs. Time Graphs • x-axis: Time • y-axis: Position • slope = velocity (slope = “rise” / “run”) • horizontal line: at rest • straight line: constant velocity • positive slope = positive velocity • negative slope = negative velocity • curved line: acceleration
Position vs. Time Graphs Determine the velocity from each of the above graphs.
Position vs. Time Graphs What is happening to the velocity of an object whose position-time graph looks like this? What is this object doing?
Velocity vs. Time Graphs • x-axis: Time • y-axis: velocity • slope = acceleration (slope = “rise” / “run”) • horizontal line: constant velocity • straight line: uniform acceleration • positive slope = positive acceleration • negative slope = negative acceleration (deceleration) • curved line: non-uniform acceleration
Velocity vs. Time Graphs Determine the acceleration from each of the above graphs.
Velocity vs. Time Graphs What is happening to the acceleration of an object whose velocity-time graph looks like this?