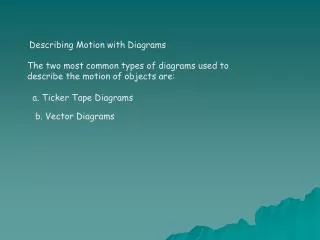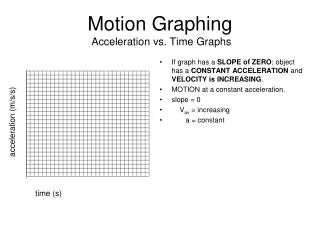
Describing Motion with Position vs. Time Graphs
230 likes | 464 Vues
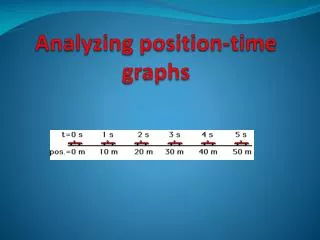
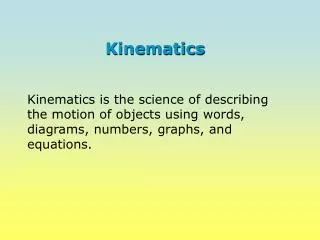
Kinematics Kinematics is the science of describing the motion of objects using words, diagrams, numbers, graphs, and equations. Describing Motion with Position vs. Time Graphs. Ex:car moving with a constant, rightward (+) velocity of 10 m/s. What would a graph for this motion look like?.

Describing Motion with Position vs. Time Graphs
E N D
Presentation Transcript
KinematicsKinematics is the science of describing the motion of objects using words, diagrams, numbers, graphs, and equations.
Describing Motion with Position vs. Time Graphs Ex:car moving with a constant, rightward (+) velocity of 10 m/s. What would a graph for this motion look like?
Determining Velocity on a p vs.t Graph • The slope of a position-time graph is the average velocity!!!!!!!!!!! • Pick two points on the line and determine their coordinates. • Determine the difference in y-coordinates of these two points (rise). • Determine the difference in x-coordinates of these two points (run). • Divide the difference in y-coordinates (rise) by the difference in x-coordinates (run).
25m-5m =20m =4m/s 5s - 0s 5 s
What can you say about the motion of the two objects represented in these graphs? Fast, moving right (+) Constant Velocity Slow, moving right (+) Constant Velocity
What can you say about the motion of the two objects represented in the graphs? Slow, moving left (–) Constant Velocity Fast, moving left (–) Constant Velocity
What if the object does not travel at a constant velocity? • Acceleration is a vector quantity which is defined as "the rate at which an object changes its velocity." An object is accelerating if it is changing its velocity • The shape of a position vs. time graph can tell you what kind of motion is occurring: • Straight line = constant velocity • Curved line = changing velocity= acceleration
Ex. 2 A car that is moving rightward and speeding up or accelerating in + direction. What would its graph look like?
Note that the constant velocity object has a constant slope and the accelerating object has a non-constant slope.
The Direction of the Acceleration Vector • Since acceleration is a vector quantity, it has a direction associated with it. The direction of the acceleration vector depends on two things: • whether the object is speeding up or slowing down • whether the object is moving in the + or - direction
The general RULE OF THUMB is: • If an object is slowing down, then its acceleration is in the opposite direction of its motion.
Slow to fast, moving right (+), acceleration in + direction Fast to slow, moving right (+) deceleration= negative acc.
Moving left (–) Velocity; Slow to Fast, Acceleration (-) Leftward (-) Velocity; Fast to Slow Acceleration (+)
Velocity vs. time graphs velocity velocity
Some practice with graph shapes • 1. Sketch a position-time graph for an object which is moving with a constant, positive velocity. • 2. Sketch a position-time graph for an object which is moving with a constant, negative velocity. • 3. Sketch a position-time graph for an object moving in the + dir'n and accelerating from a low velocity to a high velocity. • 4. Sketch a position-time graph for an object moving in the + dir'n and accelerating from a high velocity to a low velocity. • 5. Sketch a position-time graph for an object moving in the - dir'n and accelerating from a high velocity to a low velocity. • 6. Sketch a position-time graph for an object moving in the - dir'n and accelerating from a low velocity to a high velocity.
7. Sketch a position-time graph for an object moving in the + dir'n with constant speed; first a slow constant speed and then a fast constant speed. • 8. Sketch a position-time graph for an object moving in the + dir'n with constant speed; first a fast constant speed and then a slow constant speed. • 9. Sketch a position-time graph for an object moving in the - dir'n with constant speed; first a slow constant speed and then a fast constant speed. • 10. Sketch a position-time graph for an object moving in the - dir'n with constant speed; first a fast constant speed and then a slow constant speed. • 11. Sketch a position-time graph for an object which moves in the + direction at a slow constant speed and then in a - direction at a fast constant speed. • 12. Sketch a position-time graph for an object which moves in the + direction at a fast constant speed and then in a - direction at a slow constant speed. • 13. Sketch a position-time graph for an object which moves in the - direction at a slow constant speed and then in a + direction at a fast constant speed.