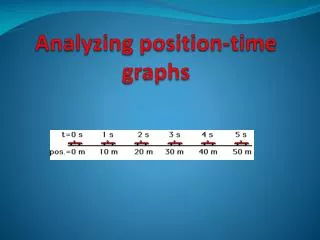
Analyzing position-time graphs
Analyzing position-time graphs. Objectives. You will be able to: Relate the slope of a position-time graph to speed Determine speed using position-time graphs Describe the type of motion indicated in a position-time graph; motion with constant speed or accelerated motion. Recall that:.

Analyzing position-time graphs
E N D
Presentation Transcript
Objectives You will be able to: • Relate the slope of a position-time graph to speed • Determine speed using position-time graphs • Describe the type of motion indicated in a position-time graph; motion with constant speed or accelerated motion
Recall that: A position vector is a vector that joins the origin to the new position of the moving object. 2. time interval= ∆t=final time- initial time. displacement= ∆d=final position- initial position. 4. A position time graph can: describe the motion of an object determine the position of the object at a certain time determine the time of an object for a certain position.
2 types of linear motion Motion with a constant speed (uniform motion) Motion with a changing speed ( Accelerated motion)
The position- time graph would be respetively: Motion with a constant speed - Position -time Line of best fit: - Relationship: Equation : y= Motion with a changing speed - Position -time Line of best fit: - Relationship: Equation : y=
Conclusion • Uniform motion ( constant speed) Position-time graph: straight line • Accelerated Motion ( varied speed) Position –time graph: parabola
Linear Uniform motion Position time graph Data Y= mx+b Where: y is the position at a certain time X is the time m= slope B= y-intercept
Uniform linear motion • Calculating slope -( rf: ch: 1 section 3) • Absolute value of slope= speed • y-intercept Represents the initial vector position of the object . 3. A line with a greater slope (steeper line ) represents a constant motion with a higher speed. App: • Find the speed and initial vector of the object whose motion is representing by the graph + question II from the worksheet • Describe the motion of an object whose motion is described by the following equation: y= -2 x+4
Accelerated Linear Motion Accelerated motion of a moving towards the origin with increasing speed Accelerated motion of a moving object towards the origin with a decreasing speed
Accelerated linear motion Object moving away the origin with an increasing speed
Acceleration- Linear Motion Equation: Y= ax² + bx +c Where a= half of the acceleration (rf . Section 2.4 How Fast?) b= initial (starting)velocity c= initial position App: Describe the motion of an object whose position –time is represented by the following equation: Y (m)= 2 x² + 3x +4
Do Not Forget • 2 types of linear motion: • Uniform motion where the speed is kept constant: • Position- time graph is represented by a straight line where : absolute value of the slope= speed • Accelerated motion where the speed is changing over time. • Position – time graph is represented by a parabola. Solve : question II & III from the worksheet
FOR NEXT TIME • Solve questions p: 53 no.54 &55 • Download PowerPoint presentation from wikispaces. • System wide quiz 2 on Sunday November 20,2o11 • Material required: • Ch 1: section 2: Measurement • Ch 1: section 3: Plotting Data • Ch 2: section 2: where and when? • Ch2: section 3: Position- time Graph