Understanding Position vs. Time Graphs: Analyzing Velocity in Air Traffic
This guide explores position vs. time graphs, focusing on how to determine if an aircraft travels at a constant speed. By examining the graph of a plane's data, we can easily identify its motion. The slope of the graph represents the velocity of the plane, confirming that it maintains a constant speed when the graph is a straight line. We also discuss positive and negative velocities, the significance of instantaneous speed, and how to calculate average and instantaneous velocities through graphical analysis.


Understanding Position vs. Time Graphs: Analyzing Velocity in Air Traffic
E N D
Presentation Transcript
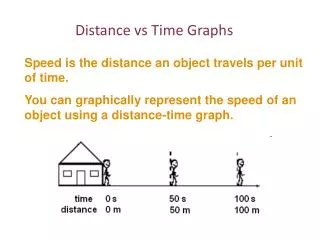
Position vs. Time Graphs 24 h of air traffic
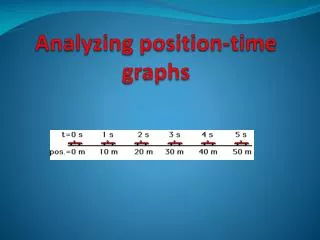
Position vs Time Graphs Is the plane travelling at a constant speed? Examine the data table of a plane in flight shown below: It is actually a little difficult to tell by just looking at the data. You could try to calculate the velocity during each successive time interval … but this becomes cumbersome.
Position vs Time Graphs There is a much easier way. Scientists use this method all the time to see if a relationship between two variables exist! That’s right … it is our old friend the GRAPH! Remember the“Toy Tractor Lab” Let us Plot a graph of position vs. time and see what comes out
Position vs Time Graphs The plot of the plane data yields the following graph: The visual picture of the graph (the straight line) tells us that the plane is travelling at a constant speed. It is easy to see this when the data is plotted on a graph.
Position vs Time Graphs Let us look at this graph one more time: Let’s determine the slope of this graph. Slope = rise/run Δd Slope = Δd/Δt But wait: We have seen this equation before! Δt
Position vs Time Graphs Look at the slope equation: Remember this equation: 1400 - 100 Δd Δd vave = Slope = Slope = 5 - 0 Δt Δt They are the same equation!!! For the plane: vave = = 260 m/s The slope of a Position vs Time graph is the same as the velocity (speed) of the object!
Position vs Time Graphs Does each of these lines show constant (uniform) velocity? Position B C A What is the difference between A & B? Time
Position vs Time Graphs Since the slope equals velocity and the slope is constant (straight line) the velocity of the plane must be constant too! Important fact: Straight line Position vs Time graphs (constant slope) show constant velocity sometimes called “Uniform Motion”!
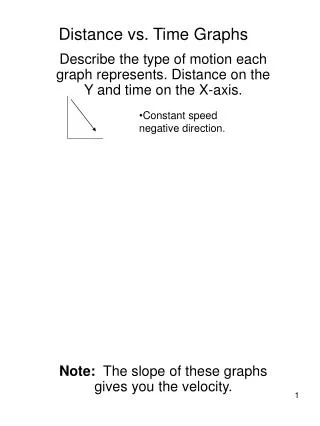
Position vs Time Graphs What kind of motion does each of the lines represent? D C Position (m) A E B 0 0 Time (s)
Positive and Negative Velocities Car A is moving to the right at 5.0 m/s Car B is moving to the left at 7.0 m/s A B -4 -3 -2 -1 0 1 2 3 4 5 6 7 8 9 10 11 12 We could also say Car A has a +5.0 m/s velocity. And Car B has a -7.0 m/s velocity. In kinematics + and – have directional meanings. It indicates the direction that an object is moving
Position vs Time Graphs D How are positive and negative velocities shown on a position vs time graph? Position (m) What is happening during each of the labeled intervals? C B E A 0 0 Time (s)
Position vs Time Graphs What would this graph mean? Position (m) This would be impossible!! This line implies that you have infinite speed or you are at more than two places (infinite places) at the SAME time! 0 0 Time (s)
Position vs Time Graphs 1 Other kinds of graphs: What kind of motion is being shown on each one 2 P P P P t t t t 3 4
Position vs Time Graphs Calculating Average Velocities: 1) Select two points that you are interested in Position (m) Δd vave = 2) Connect your two points with a straight line Δt Δd 3) Calculate the slope of this line Δt 0 0 Time (s) The slope of a line connecting two points on a position vs time graph is called the average velocity.
Position vs Time Graphs Its great to know your average speed but sometimes you need to know your exact speed at a point in time. Instantaneous Velocities (The “right-now” speed) This absolutely critical to the pilot of an airplane at take and landing or a race car going around a corner or the exact speed of a bearing in a power plant How can you use your position vs. time graph to find this instantaneous speed?
Position vs Times Graphs Position (m) For constant velocity situations (straight line) the instantaneous velocity and average velocity are the same! Time (s)
Position vs Time Graphs But what happens when your velocity is not constant? P The line is a curve which means he velocity is always increasing! There is not a single value for the velocity. t We could calculate the instantaneous velocity or the velocity at a given point.
Position vs Time Graphs Calculating Instantaneous Velocities: P 1) Select the time, t1, that you are interested in Δd v = Δt 2) Draw in a “tangent line” at that point. Δd 3) Calculate the slope of this tangent line Δt t1 t
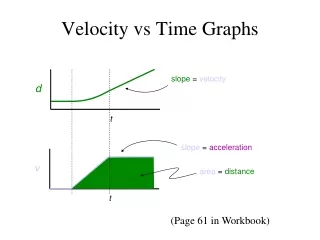
Position vs Time Graphs Go on to do: Acceleration Motion: Cart on an Incline Lab