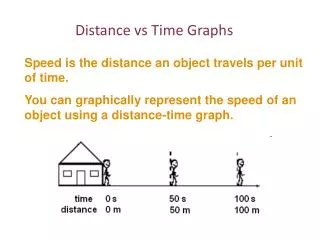
Distance vs. Time Graphs
Distance vs. Time Graphs. Constant speed negative direction. Describe the type of motion each graph represents. Distance on the Y and time on the X-axis. Note: The slope of these graphs gives you the velocity. Distance vs. Time Graphs. Constant speed negative direction. Standing Still.

Distance vs. Time Graphs
E N D
Presentation Transcript
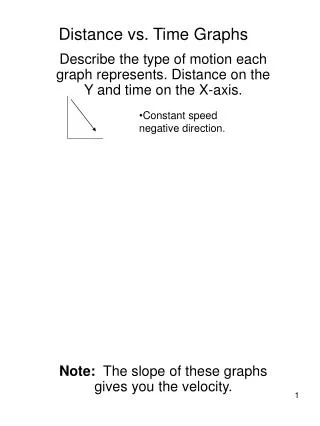
Distance vs. Time Graphs • Constant speed negative direction. Describe the type of motion each graph represents. Distance on the Y and time on the X-axis. Note: The slope of these graphs gives you the velocity.
Distance vs. Time Graphs • Constant speed negative direction. • Standing Still Describe the type of motion each graph represents. Distance on the Y and time on the X-axis. Note: The slope of these graphs gives you the velocity.
Distance vs. Time Graphs • Constant speed negative direction. • Standing Still • Decreasing velocity • -a Describe the type of motion each graph represents. Distance on the Y and time on the X-axis. Note: The slope of these graphs gives you the velocity.
Distance vs. Time Graphs • Constant speed negative direction. • Standing Still • Decreasing velocity • -a • Decreasing velocity • -a Describe the type of motion each graph represents. Distance on the Y and time on the X-axis. Note: The slope of these graphs gives you the velocity.
Distance vs. Time Graphs • Constant speed negative direction. • Standing Still • Decreasing velocity • -a • Decreasing velocity • -a • Increasing Velocity • +a Describe the type of motion each graph represents. Distance on the Y and time on the X-axis. Note: The slope of these graphs gives you the velocity.
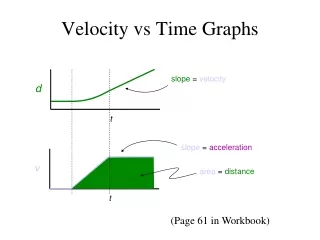
Velocity vs. Time Graphs • Describe the type of motion each graph represents. Velocity on the Y-axis and Time on the X-axis. Note: The slope of these graphs give you acceleration. The area under the curves gives you displacement. Constant “+” acceleration
Velocity vs. Time Graphs • Describe the type of motion each graph represents. Velocity on the Y-axis and Time on the X-axis. Note: The slope of these graphs give you acceleration. The area under the curves gives you displacement. Constant “+” acceleration No Acceleration (Constant speed “+” direction)
Velocity vs. Time Graphs • Describe the type of motion each graph represents. Velocity on the Y-axis and Time on the X-axis. Note: The slope of these graphs give you acceleration. The area under the curves gives you displacement. Constant “+” acceleration No Acceleration (Constant speed “+” direction) Constant “-” acceleration
Velocity vs. Time Graphs • Describe the type of motion each graph represents. Velocity on the Y-axis and Time on the X-axis. Note: The slope of these graphs give you acceleration. The area under the curves gives you displacement. Constant “+” acceleration No Acceleration (Constant speed “+” direction) Constant “-” acceleration Ball being thrown up and falling down. Or a child on a swing (pendulum).
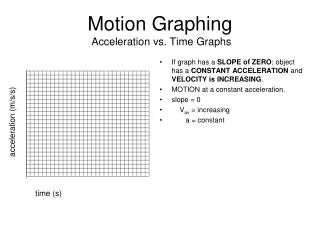
Acceleration vs. Time • The area under the curve of these graphs will give you velocity. Constant “+” acceleration
Acceleration vs. Time • The area under the curve of these graphs will give you velocity. Constant “+” acceleration Zero Acceleration (Constant Speed)
Acceleration vs. Time • The area under the curve of these graphs will give you velocity. Constant “+” acceleration Zero Acceleration (Constant Speed) Constant “-” acceleration
Story Time? • Tell me a story for the following graphs. • Distance vs. Time and then Velocity vs. Time.
d t Graph Overlays? • Take the previous Distance vs. Time a draw a Velocity vs. Time graph which would show the same movements.
d t v t Graph Overlays? • Take the previous Distance vs. Time a draw a Velocity vs. Time graph which would show the same movements.