Download
1 / 10
100 likes | 128 Vues
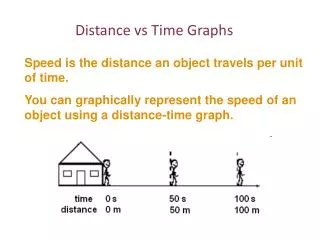
This graphing activity involves observing a car's journey along a straight road, recording distances at intervals, and plotting a distance-time graph based on the collected data to analyze the car's speed variations.

E N D
Car Graphing Activity This graphing experiment shows a movie of a car travelling along a straight road. Copy the results table shown on the next slide and complete it as the movie is played. Record the distance the car has travelled every five seconds. Then graph your results. Note that there are teacher’s notes, in “Notes View” on this slide. See teacher’s notes
0 16 76 186 234 484 634 784 904 974 994 994 Results table for Distance / Time Graph
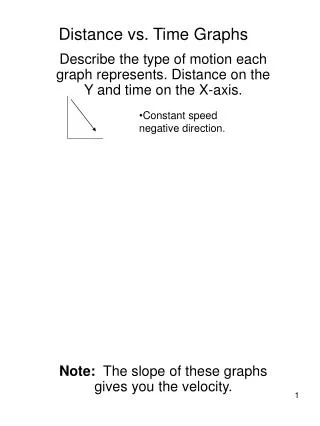
The car is starting to move. The curve shows that the speed is changing. The curve is upwards as the car accelerates at the start of the movie. The car is going fast but at a constant speed. The line is straight in this region of the graph. The car has stopped: The line is flat – the distance of the car from the start point is not changing. The line is straight – meaning that there is no CHANGE in speed. The line on the graph is not straight, so we know the speed of the car is changing. The curve is downwards as the car slows down at the end of the movie.
Gradient of a Distance / Time Graph The speed of the car can be calculated by looking at the gradient of the Distance / Time graph. Speed is “Distance Travelled divided by Time Taken” Both these values can be read off the Distance / Time graph, and this is the same as the gradient of the line.
Look at the straight line part of this graph shown by the two arrows in a triangle. The car has travelled from 200m to 800m, = 600m The car has taken from 16s to 36s to travel this distance = 20 seconds Therefore the speed is 600 divided by 20 = 30 m/s