Velocity-Time Graphs
Velocity-Time Graphs. 2 nd March 2012. Top Gear - Measuring Increases In Speed. Learning objectives. Bronze - Able to draw and interpret velocity- time graphs Silver - Be able to calculate acceleration from a distance-time graph Gold – Be able to make your own v/ t graph.

Velocity-Time Graphs
E N D
Presentation Transcript
Velocity-Time Graphs 2nd March 2012
Learning objectives • Bronze - Able to draw and interpret velocity-time graphs • Silver - Be able to calculate acceleration from a distance-time graph • Gold –Be able to make your ownv/tgraph.
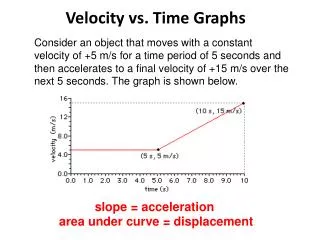
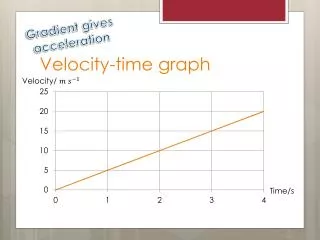
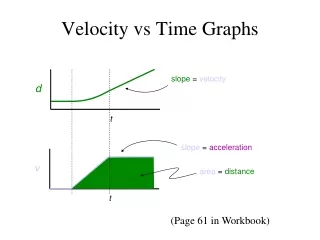
Velocity – Time Graph The graph is going to show part of my journey to school. It took 30s and my maximum velocity was 24 m/s. I started the stopwatch and put my foot on the accelerator. 12 seconds later I was travelling at 24 m/s. I could see the traffic lights so I pressed the brake. 2 s later I had stopped (14s in total). The lights immediately turned green so I hit the accelerator again. I got to 10m/s after 6s (20s in total). This was the speed limit so I continued on at 10m/s for another 4s (24s in total). I could see the school so I hit the brake and 6s later I had stopped (30s in total).
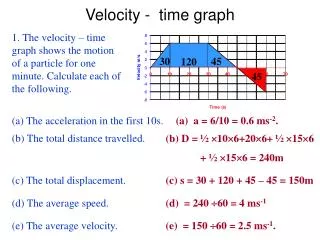
Draw velocity-time graphs for the journeys on the sheets. • Annotate the graphs to show the different stages. • Calculate the acceleration or deceleration for each stage.
Produce your own velocity-time graph for a journey you take regularly. • You can estimate the velocity. • It may help if you first draw a table showing the velocity at each time. • Finish for homework.