Understanding Velocity-Time Graphs: Analyzing Object Motion
Velocity-time graphs are essential tools for visualizing an object's motion over time. By plotting time on the x-axis and velocity on the y-axis, these graphs enable us to determine whether an object is moving forward or backward, its speed, and whether it is accelerating or decelerating. Different graph slopes indicate changes in motion: a downward slope shows deceleration, a horizontal line indicates constant velocity, and an upward slope signifies acceleration. This guide explores the fundamental principles of interpreting velocity-time graphs, including the calculation of acceleration.

Understanding Velocity-Time Graphs: Analyzing Object Motion
E N D
Presentation Transcript
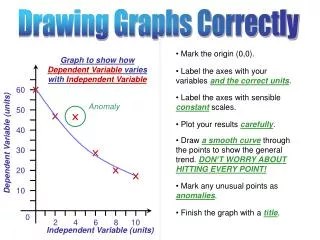
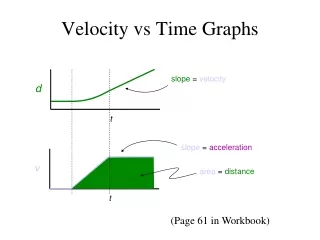
In the same way that you can record an object’s distance at different times, you can also record an object’s velocity at different times. • You can plot this data on a velocity–time graph. Time is usually plotted on the x-axis and velocity on the y-axis. • The velocity is plotted at different times and the graph can then tell you whether the object is moving forwards or backwards, at what speed and whether it is speeding up or slowing down.
If the object is slowing down steadily, the velocity is steadily decreasing, and the graph shows a straight line sloping downwards. • If an object is moving at a steady (constant) velocity, the line on the graph is horizontal; the velocity is not changing. The greater the velocity the higher the horizontal line. This velocity-time graph shows the velocity at different times for a train travelling on a track between two stations. • If the object is going steadily faster, the velocity is steadily increasing, and the graph shows a straight line sloping upwards. • If the object moves backwards, the velocity is negative, and so those graph points will be plotted below the x-axis.
We can calculate the acceleration using this formula: Change in velocity = 18m/s Acceleration = Change in velocity Time Time = 15 seconds The units of acceleration are: metres per second / seconds We write this as ‘metres per second squared (m/s2)