9/30/14 Velocity graphs
140 likes | 373 Vues
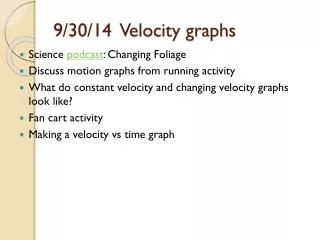
9/30/14 Velocity graphs. Science podcast : Changing Foliage Discuss motion graphs from running activity What do constant velocity and changing velocity graphs look like? Fan cart activity Making a velocity vs time graph. Learning Objectives.

9/30/14 Velocity graphs
E N D
Presentation Transcript
9/30/14 Velocity graphs • Science podcast: Changing Foliage • Discuss motion graphs from running activity • What do constant velocity and changing velocity graphs look like? • Fan cart activity • Making a velocity vs time graph
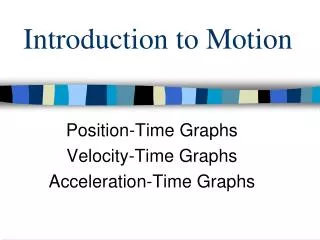
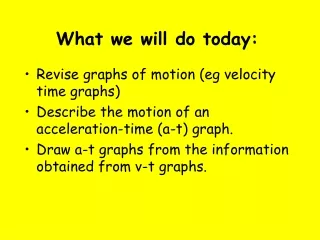
Learning Objectives • Sketch a graph of uniform, speeding up, or slowing down motion • Apply the definition of velocity to solve for an unknown • Interpret the components of the equation of a velocity vs time graph
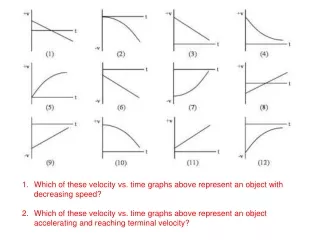
Constant velocity • The car moves equal intervals in equal amounts of time. • Car is not speeding up or slowing down (or changing direction). • Graph is a straight line. See example. • How do we know the car is not speeding up or slowing down between data points?
Increasing velocity • The car moves increasing distances in equal amounts of time. • Graph is a upward curve. • How do we know the car is not constant or slowing down between data points? • Compare different cars. • Go over homework from yesterday
Fan Cart Activity • Today you will get a car that speeds up. Please be careful of the propeller. It can pinch your finger. • You will also get a tape timer, a device that puts a mark on a paper every 0.1 s or 0.025 s. • Attach about 1 m of tape to the back of your cart. • Make a data table with about 10 position and corresponding time values. Don’t use every point! • Use Excel to make a position vs. time and velocity vs. time graph for your car. I have put an Excel worksheet template on the course website • http://cwuphys106.pbworks.com/
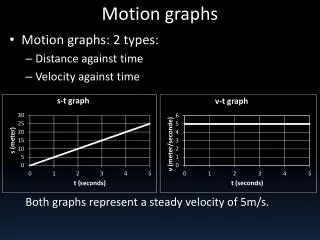
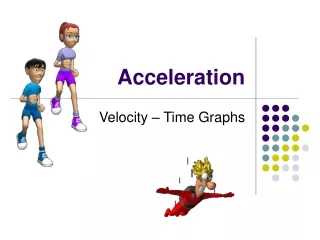
Graphing motion • To make a position vs time graph, plot time along the x-axis and position along the y-axis. • To make a velocity vstime graph, plot time along the x-axis and velocity along the y-axis. • Determine the best fit curve using Excel (either linear or polynomial) • Email to palmquis@cwu.edu Sample data
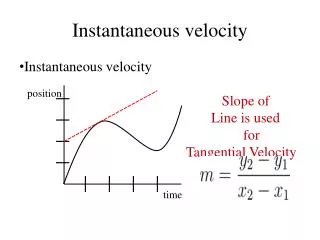
Sample Velocity vs. time graph • The line equation is y = mx + b • What are y, x, m, b? • Here y is velocity, x is time, m describes the rate of speeding up, and b is initial velocity
Revisit Motion pretest • Does today’s activity help us answer any of the Motion pretest items? • How do we know if there is acceleration? • When the velocity does not change. • Item 6 on the pretest asks about this.
Motion pretest 2014 Number of responses for each choice. Correct answer in red.
Motion pretest 2013 Number of responses for each choice. Correct answer in red.
Motion pretest 2012 Number of responses for each choice. Correct answer in red.
Motion pretest 2011 Number of responses for each choice. Correct answer in red.
Motion pretest 2010 Number of responses for each choice. Correct answer in red.