Download
1 / 12
120 likes | 197 Vues
Learn about velocity-time and distance-time graphs, acceleration, and displacement. Practice questions and challenges included. Perfect for A Level Physics Year 1 students. Enhance your understanding of motion graphs!

E N D
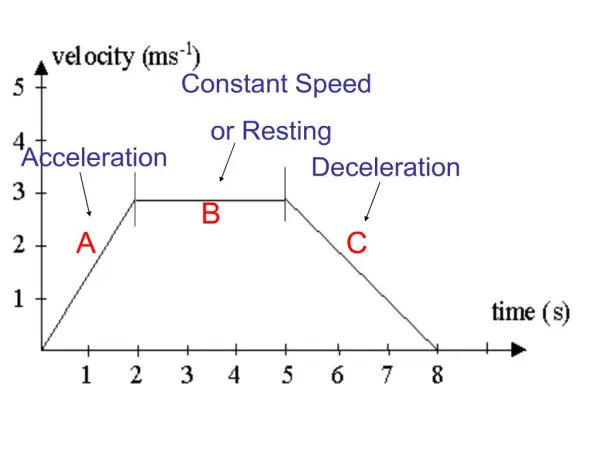
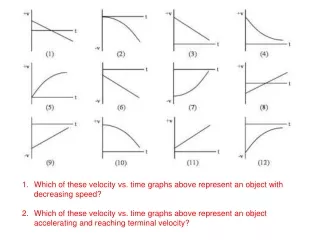
Which of these velocity vs. time graphs above represent an object with decreasing speed? • Which of these velocity vs. time graphs above represent an object accelerating and reaching terminal velocity?
A LEVEL PHYSICSYear 1 A* • I can describe the difference between a distance-time graph and a displacement-time graph (grade d) • I can determine acceleration and displacement from a velocity time graph (grade b) • I know the link between distance/time, velocity/time and acceleration/time graphs (grade a). Motion Graphs A B C
Distance-time graph • The displacement time graph opposite shows a ball being thrown vertically and falling. • Sketch the information in a distance-time graph.
Quick Question • A swimmer swims 100m from one end of the pool at a constant speed of 1.2 ms-1 then swims back at a constant speed returning to the starting point 210s after starting. • Calculate the time taken for the first ‘length’ and the return length. • Sketch a) displacement-time graph b) distance time graph c) velocity-time graph
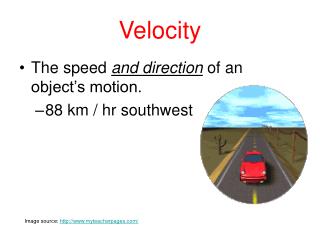
Velocity-time graphs • Assign +ve as one direction and –ve as the other direction • Make up a story to fit the adjacent graph • Draw a velocity-time graph for the ball being thrown vertically
Quick Question 2 • A motorcyclist travelling on a straight road at a constant speed of 8.8 ms-1 passes a cyclist travelling in the same direction at 2.2 ms-1. After 200 s the motorcyclist stops. • Calculate how long the motorcyclist has to wait for the cyclist to catch up. • On the same axes, sketch a velocity-time graph for both objects
Standard Challenge • Q2 Applications pg.128 • Q4 Fact Recall pg.129 • Q2 Applications pg.134 • Q2 and 3 Applications pg.136 • Q2 Applications pg.128 • Q4 Fact Recall pg.129 • Q2 Applications pg.134 • Q4 Fact Recall pg. 134 • Q2 and 3 Applications pg.136 • Q3 Fact Recall pg. 136