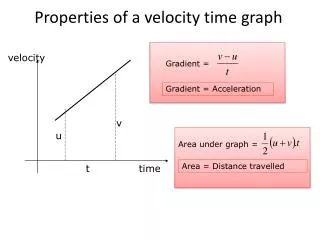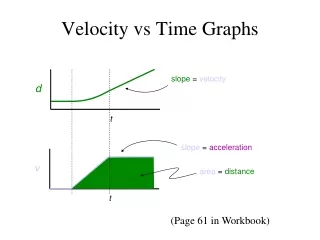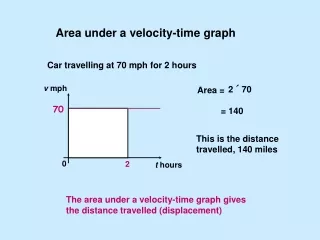
Velocity - time graph
Velocity - time graph. 1. The velocity – time graph shows the motion of a particle for one minute. Calculate each of the following. 30. 45. 120. 45. (a) The acceleration in the first 10s. . (a) a = 6/10 = 0.6 ms -2 . (b) The total distance travelled. (b) D = ½ 106+206+ ½ 156

Velocity - time graph
E N D
Presentation Transcript
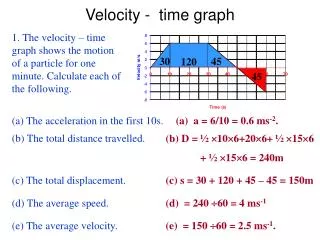
Velocity - time graph 1. The velocity – time graph shows the motion of a particle for one minute. Calculate each of the following. 30 45 120 45 (a) The acceleration in the first 10s. (a) a = 6/10 = 0.6 ms-2. (b) The total distance travelled. (b) D = ½ 106+206+ ½ 156 + ½ 156 = 240m (c) The total displacement. (c) s = 30 + 120 + 45 – 45 = 150m (d) The average speed. (d) = 240 60 = 4 ms-1 (e) The average velocity. (e) = 150 60 = 2.5 ms-1.
Velocity - time graph 2. A car leaves a point O and accelerates uniformly from rest to a speed of 6 ms-1 in 4 seconds. It then maintains a steady speed for a further 10 seconds, after which it slows down to a halt in 2 seconds. (a) Sketch a speed–time graph for the car’s journey. Speed ms-1 6 t=4 t=14 t=16 time (t)
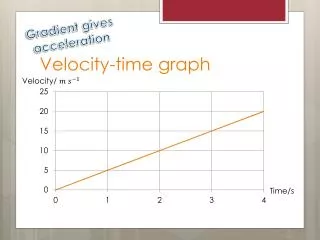
Velocity - time graph (b) Find the acceleration during the initial and final stages of the journey. Speed ms-1 6 t=4 t=14 t=16 time (t) The initial stage: Acceleration = gradient = 6 4 = 1.5 ms-2 The final stage: Acceleration = gradient = -6 2 = -3 ms-2
Velocity - time graph (c) Find the total distance travelled by the car. Speed ms-1 6 60 6 12 t=4 t=14 t=16 time (t) Distance travelled = Total area: Area = ½ 6 4 + 6 10 + ½ 6 2 = 12 + 60 + 6 = 78 m
speed (m s–1) second car first car time (t) (seconds) 3. Two cars set off on a journey. The first car leaves at time t = 0, where t is measured in seconds. It accelerates uniformly until it reaches a speed of 8 m s–1 at t = 3 s. It then maintains a constant velocity. The second car leaves from the same point at t = 3 and travels with constant speed 16 m s–1. (a) On the same axes sketch speed–time graphs for the motion of the two cars.
speed (m s–1) second car first car time (t) (seconds) (b) Find t when the two cars meet. Suppose the cars meet after t seconds: First car: s = ½ 8 3+ 8(t – 3) Second car: s = 16(t – 3) 16(t – 3) = ½ 8 3+ 8(t – 3) 16t – 48 = 12 + 8t - 24 8t = 36 t = 4.5 s
Displacement m 0 3 time (t) (c) How far are they from the start at this time ? 16( t – 3) Distance travelled by the first car = = 16( 4.5 – 3) = 24m So, they meet 24 m from the start. d) Sketch a displacement–time graph for the journey of the second car.
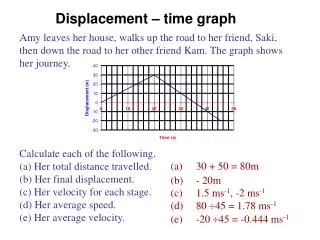
4. The graph shows the motion of a bungee jumper. 50 8 (a) State two non-zero times at which the velocity of the jumper is zero. (a) t = 4 s and t = 5.6 s (b) Find the total distance travelled and the final displacement. (b) D = ½ 4 25 + ½ 1.610 = 58m s = ½ 4 25 - ½ 1.610 = 42m below starting position.