Distance vs Time Graphs
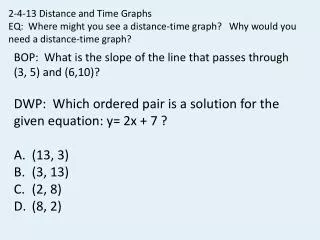
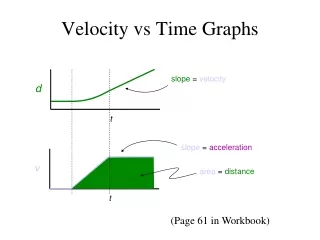
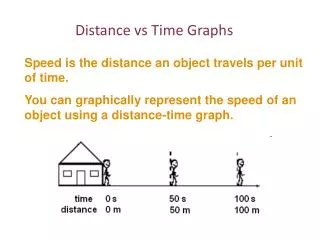
Distance vs Time Graphs. Speed is the distance an object travels per unit of time. You can graphically represent the speed of an object using a distance-time graph. If the speed is constant, then the slope is constant (straight line). Constant Speed.

Distance vs Time Graphs
E N D
Presentation Transcript
Distance vs Time Graphs Speed is the distance an object travels per unit of time. You can graphically represent the speed of an object using a distance-time graph.
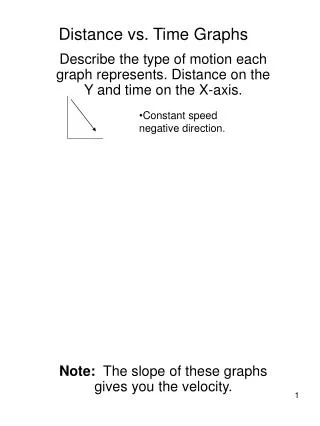
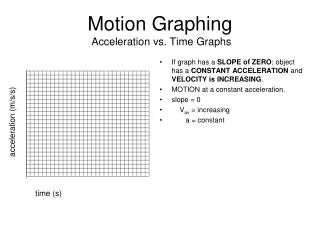
If the speed is constant, then the slope is constant (straight line).
Constant Speed A uniform distance is covered for each unit of time. A constant speed graph shows a constant & positive slope
If the speed is changing, then the slope is changing (curve).
Describe the motion in each section of the graph. Decelerating Stopped Accelerating Steady speed