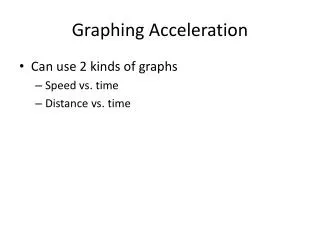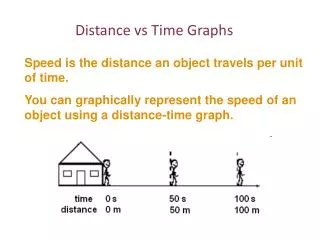
Motion Graphing Acceleration vs. Time Graphs
60 likes | 272 Vues
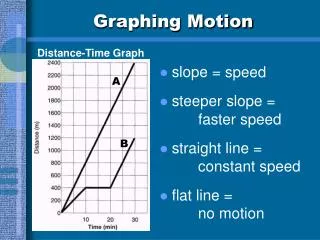
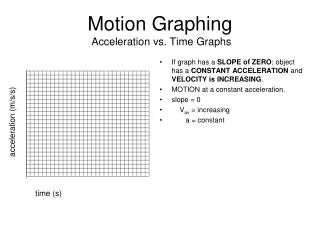
If graph has a SLOPE of ZERO ; object has a CONSTANT ACCELERATION and VELOCITY is INCREASING . MOTION at a constant acceleration. slope = 0 V av = increasing a = constant. Motion Graphing Acceleration vs. Time Graphs. acceleration (m/s/s). time (s).

Motion Graphing Acceleration vs. Time Graphs
E N D
Presentation Transcript
If graph has a SLOPE of ZERO; object has a CONSTANT ACCELERATION and VELOCITY is INCREASING. MOTION at a constant acceleration. slope = 0 Vav = increasing a = constant Motion Graphing Acceleration vs. Time Graphs acceleration (m/s/s) time (s)
If intervals between acceleration & time intersection points are same; graph represents object moving with INCREASINGACCELERATION; VELOCITY INCREASING greater slope = greater acceleration and velocity is increasing SIGN of slope on an acceleration/time graph indicates CHANGE IN ACCELERATION of object’s travel, or change in DIRECTION of acceleration when below axis POSITIVE (+) slope indicates increasing acceleration, or change in direction of acceleration when below x-axis Motion Graphing Acceleration vs. Time Graphs acceleration (m/s/s) time (s)
If intervals between acceleration & time intersection points are same; graph represents object moving with DECREASINGACCELERATION; VELOCITY DECREASING greater slope = greater acceleration and velocity is decreasing SIGN of slope on an acceleration/time graph indicates CHANGE IN ACCELERATION of object’s travel, or change in DIRECTION of acceleration when below x-axis NEGATIVE (-) slope indicates decreasing acceleration, or change in direction of accelerationwhen below x-axis Motion Graphing Acceleration vs. Time Graphs acceleration (m/s/s) time (s)
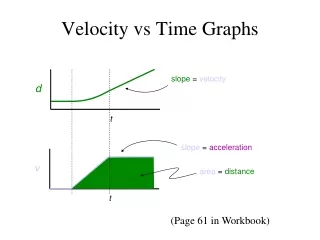
AREA under curve of a Velocity/Time graph is DISTANCE traveled by object. Object with initial Constant Velocity Vav =DxDx = VavDt Dt Motion Graphing Velocity vs. Time Graphs velocity (m/s) time (s)
AREA under curve of a Velocity/Time graph is DISTANCE traveled by object. Object from rest, velocity increasing at constant rate Dx = 1aDt2 2 Motion Graphing Velocity vs. Time Graphs velocity (m/s) time (s)
AREA under curve of a Velocity/Time graph is DISTANCE traveled by object. Object with initial speed, velocity increasing at constant rate Dx = ViDt + 1aDt2 2 Motion Graphing Velocity vs. Time Graphs velocity (m/s) time (s)