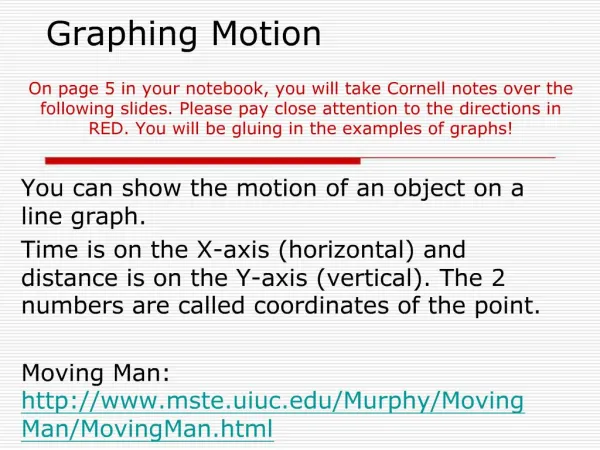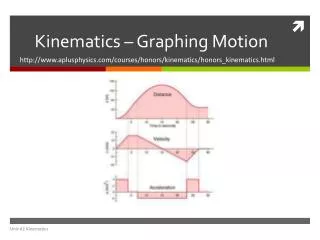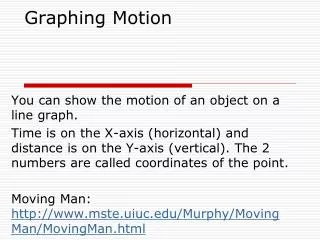
Graphing Motion
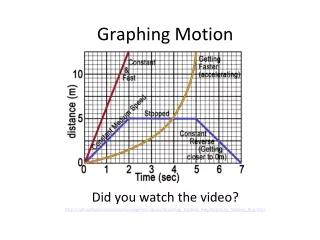
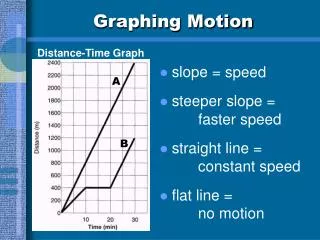
Distance-Time Graph. A. B. Graphing Motion. slope = steeper slope = straight line = flat line =. speed. faster speed. constant speed. no motion. Distance-Time Graph. A. B. Graphing Motion. Who started out faster? A (steeper slope) Who had a constant speed? A

Graphing Motion
E N D
Presentation Transcript
Distance-Time Graph A B Graphing Motion • slope = • steeper slope = • straight line = • flat line = speed faster speed constant speed no motion
Distance-Time Graph A B Graphing Motion • Who started out faster? • A (steeper slope) • Who had a constant speed? • A • Describe B from 10-20 min. • B stopped moving • Find their average speeds. • A = (2400m) ÷ (30min) A = 80 m/min • B = (1200m) ÷ (30min) B = 40 m/min
Distance-Time Graph Graphing Motion • Acceleration is indicated by a curve on a Distance-Time graph. • Changing slope = changing velocity
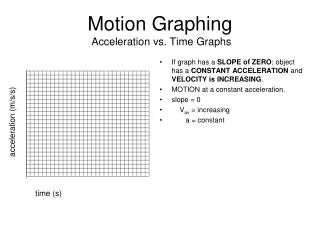
Speed-Time Graph Graphing Motion • slope = • straight line = • flat line = acceleration • +ve = speeds up • -ve = slows down constant accel. no accel. (constant velocity)
Speed-Time Graph Graphing Motion Specify the time period when the object was... • slowing down • 5 to 10 seconds • speeding up • 0 to 3 seconds • moving at a constant speed • 3 to 5 seconds • not moving • 0 & 10 seconds