Motion Graphs: Ticker Tape, Moving Man & More
Explore graphs depicting motion concepts like velocity, acceleration, and displacement using visual examples and diagrams. Learn how to interpret motion trails and velocity-time graphs to analyze speed changes. Practice questions included.

Motion Graphs: Ticker Tape, Moving Man & More
E N D
Presentation Transcript
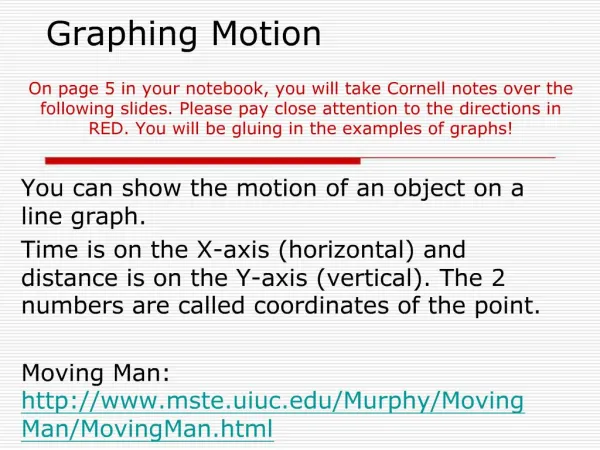
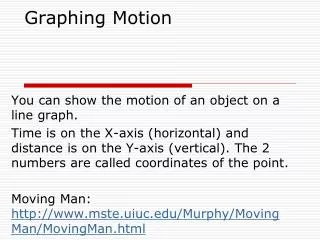
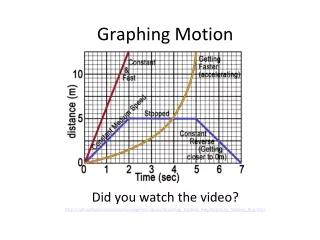
Graphing Motion Did you watch the video? http://aplusphysics.com/courses/regents/videos/Graphing_Motion_Reg/Graphing_Motion_Reg.html
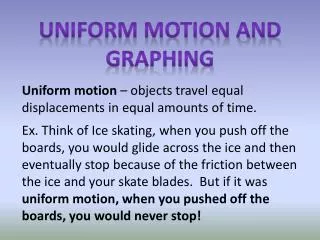
“Ticker Tape” Diagrams (car with oil leak): -Think of them as motion trails… - + No movement - + Constant velocity
- + Positive acceleration to the right- speeding up + - Negative acceleration to the right- slowing down
- + Constant velocity and then speeding up + - Slowing down…stopped…speeding up Now let’s interpret graphs…”Moving Man”
Not moving Moving away from origin Moving toward origin
Moving away from origin- moved 5 m in 5 s = 5m/5s = velocity is 1m/s Moving toward origin- moved -5 m in 2.5 s = 5m/2.5s = velocity -2m/s Standing still for 5 s = velocity 0m/s
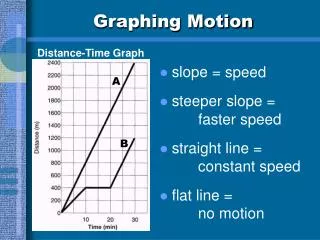
0 m/s 1 m/s -2 m/s The slope on a distance vs. time graph = velocity
Line is curved = speed is not constant (slope is changing) • Is the object speeding up or slowing down? • Instantaneous velocities are found by using tangents. d t Speeding up- slopes get steeper and steeper.
How about this graph? d t not moving constant speed slowing down
Corresponding velocity graphs: 100 v (m/s) 20 80 d (m) t 60 40 20 0 1 2 3 4 5 t (s)
Draw velocity vs. time graphs for our other examples: v d t t
v d t t
v d t t
v d t t
v d t t
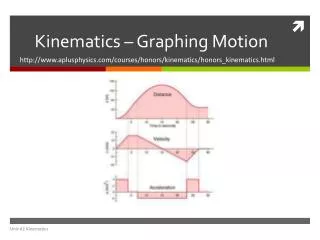
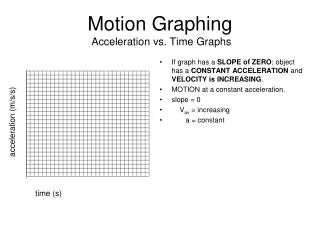
What’s the slope of a velocity graph? Δ v Δ t v t That’s acceleration!
acceleration vs. time graphs v a d t t t
How do we graph this on a v vs. t graph? 100 m/s 80 m/s d 60 m/s 40 m/s 20 m/s 10 m/s 2 4 6 8 10 t
v 10 m/s t 2 4 6 8 10 12 14 16
How do we graph this on a v vs. t graph? 100 m/s 80 m/s d 60 m/s 40 m/s 20 m/s 10 m/s 2 4 6 8 10 12 14 16 t
v 10 m/s t 2 4 6 8 10 12 14 16 How do we graph this on an a vs. t graph?
a 1 m/s/s t 2 4 6 8 10 12 14 16
What if we have a velocity vs. time graph and we want to know the displacement? How do we work backwards? Find area under the curve. v 10 m/s 80 m 18 m t 2 4 6 8 10 12 14 16 98 m