Key Characteristics of Data Analysis: Understanding Center, Variation, Distribution, and Outliers
In data analysis, recognizing key characteristics is essential for effective interpretation. The center indicates the average value, while variation measures how dispersed the data points are. Distribution shapes, like bell-shaped or skewed, reveal data behavior, influenced by outliers—values that stray far from the norm. Over time, data characteristics may change, affecting analysis. By examining histograms, one can identify peaks, flatness, U-shapes, and clustering, guiding the decision-making process by selecting suitable statistical methods for each data set.

Key Characteristics of Data Analysis: Understanding Center, Variation, Distribution, and Outliers
E N D
Presentation Transcript
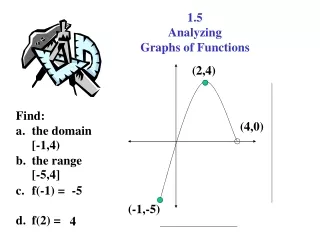
Analyzing Graphs Section 2.3
Important Characteristics of Data • Center: a representative or average value that indicates where the middle of the data set is located • Variation: a measure of the amount that the values vary among themselves • Distribution: the nature or shape of the distribution of data (such as bell-shaped, uniform, or skewed) • Outliers: Sample values that lie very far away from the majority of other sample values • Time: Changing characteristics of data over time
Distribution • The nature or shape of the distribution can be determined by viewing the histogram or other graphs. • Knowing the shape of the distribution helps to determine the appropriate statistical methods to use when analyzing the data. • Distributions are most often not perfectly shaped, so focus on the overall pattern, not the exact shape
Common Distribution Shapes(p. 56) Bell-shaped (Normal) has a single peak and tapers at either end Uniform is basically flat or rectangular
Right Skewed peaks on the left and tapers on the right Left Skewed peaks on the right and tapers on the left
Distribution Decision Making • When you analyze histograms, look at the shape of the curve and ask yourself: • Does it have one peak or two peaks? • Is it relatively flat? • Is it relatively U-shaped? • Are the data values spread out on the graph? • Are the data values clustered around the center? • Are the data values clustered on the right or left ends? • Are there data values in the extreme ends? (outliers)