Download
1 / 28
290 likes | 445 Vues
Perception and Measurement of Light, Color, and Appearance. Problems. How do cameras measure light and color? Radiometry How do humans perceive light and color? Photometry How do monitors display light and color?. Perceived brightness. Amount of light. Intensity.

E N D
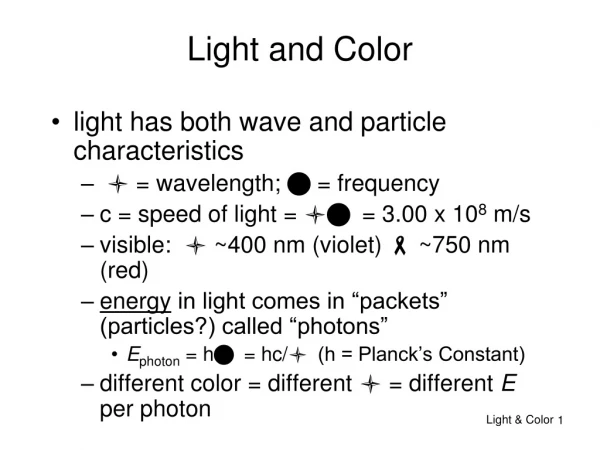
Problems • How do cameras measure light and color? • Radiometry • How do humans perceive light and color? • Photometry • How do monitors display light and color?
Perceivedbrightness Amount of light Intensity • Perception of intensity is nonlinear
B I Modeling Nonlinear Intensity Response • Brightness (B) usually modeled as a logarithm or power law of intensity (I) • Exact curve varies with ambient light,adaptation of eye
CRT Response • Power law for Intensity (I) vs.applied voltage (V) • Other displays (e.g. LCDs) contain electronics to emulate this law
Digression: Monitor Knobs • “Brightness” knob is offset • “Contrast” knob is scale • Yes, the names are misleading…
Cameras • Original cameras based on Vidicon obey power law for Voltage (V) vs. Intensity (I): • Vidicon + CRT = almost linear!
CCD Cameras • Camera gamma codified in NTSC standard • CCDs have linear response to incident light • Electronics to apply required power law • So, pictures from most cameras (including digital still cameras) will have g = 0.45
Consequences for Vision • Output of most cameras is not linear • Know what it is! (Sometimes system automagically applies “gamma correction”) • Necessary to correct raw pixel values for: • Reflectance measurements • Shape from shading • Photometric stereo • Recognition under variable lighting
Consequences for Vision • What about e.g. edge detection? • Often want “perceptually significant” edges • Standard nonlinear signal close to (inverse of)human response • Using nonlinear signal often the “right thing”
Contrast Sensitivity • Contrast sensitivity for humans about 1% • 8-bit image (barely) adequate if using perceptual (nonlinear) mapping • Frequency dependent: contrast sensitivity lower for high and very low frequencies
Contrast Sensitivity • Campbell-Robson contrast sensitivity chart
Bits per Pixel – Scanned Pictures 8 bits / pixel / color 6 bits / pixel / color Marc Levoy / Hanna-Barbera
Bits per Pixel – Scanned Pictures (cont.) 5 bits / pixel / color 4 bits / pixel / color Marc Levoy / Hanna-Barbera
Bits per Pixel – Line Drawings 8 bits / pixel / color 4 bits / pixel / color Marc Levoy / Hanna-Barbera
Bits per Pixel – Line Drawings (cont.) 3 bits / pixel / color 2 bits / pixel / color Marc Levoy / Hanna-Barbera
Color • Two types of receptors: rods and cones Rods and cones Cones in fovea
Rods and Cones • Rods • More sensitive in low light: “scotopic” vision • More dense near periphery • Cones • Only function with higher light levels:“photopic” vision • Densely packed at center of eye: fovea • Different types of cones color vision
Color • 3 types of cones: L, M, S
Tristimulus Color • Any distribution of light can be summarized by its effect on 3 types of cones • Therefore, human perception of color is a3-dimensional space • Metamerism: different spectra, same response • Color blindness: fewer than 3 types of cones • Most commonly L cone = M cone
Colorspaces • Different ways of parameterizing 3D space • RGB • Official standard: R = 645.16 nm, G = 526.32 nm, B = 444.44 nm • Most monitors are some approximation to this
XYZ Colorspace • RGB can’t represent all pure wavelengths with positive values • Saturated greens would require negative red • XYZ colorspace is a linear transform of RGB so that all pure wavelengths have positive values
Colorspaces for Television • Differences in brightness more important than differences in color • YCrCb, YUV, YIQ colorspaces = linear transforms of RGB • Lightness: Y=0.299R+0.587G+0.114B • Other color components typically allocated less bandwidth than Y
Perceptually-Uniform Colorspaces • Most colorspaces not perceptually uniform • MacAdam ellipses: color within each ellipse appears constant (shown here 10X size)
Perceptually-Uniform Colorspaces • u’v’ space • Not perfect, but better than XYZ
L*a*b* Color Space • Another choice: L*a*b*
L*a*b* Color Space • Often used for color comparison when “perceptual” differences matter