
SlideServe
Menu
Préférences
© SlideServe · v2026

ELT Stellar Populations Science

asher avatar
8 diapositives · 259 Views · Aug 27, 2014

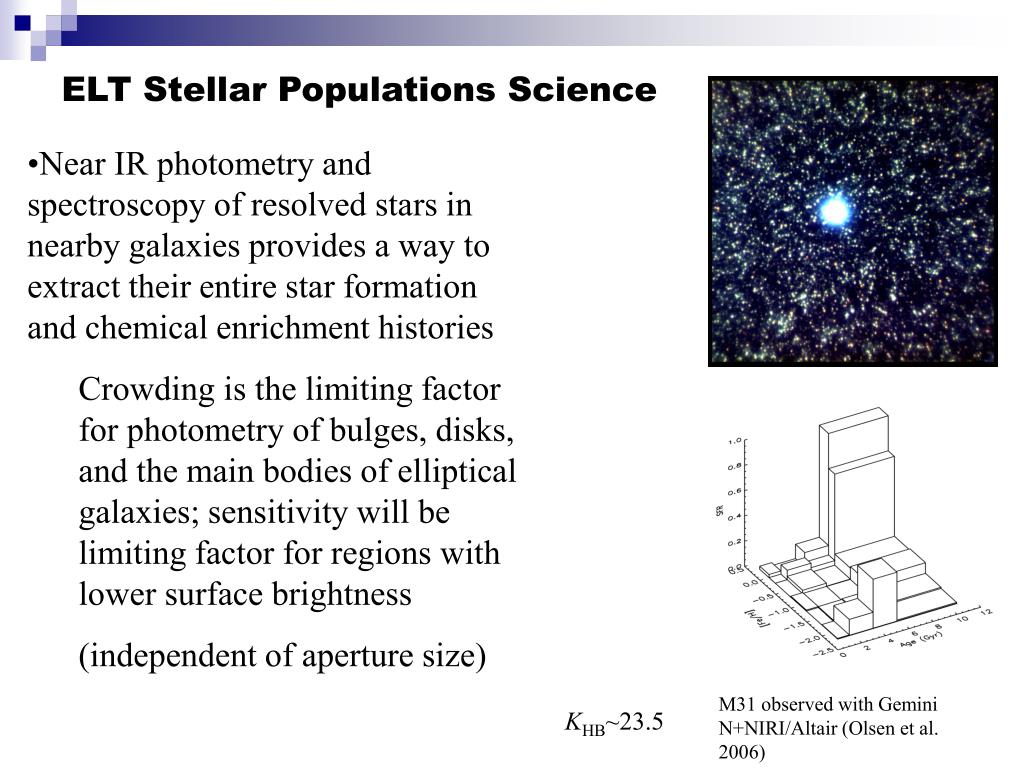
ELT Stellar Populations Science. Near IR photometry and spectroscopy of resolved stars in nearby galaxies provides a way to extract their entire star formation and chemical enrichment histories
ELT Stellar Populations Science - slide 1
01 / 8ELT Stellar Populations Science
1 / 17

Télécharger la présentation

ELT Stellar Populations Science
Une image / un lien ci-dessous est fourni (tel quel) pour télécharger la présentation

Politique de téléchargement : le contenu du site vous est fourni TEL QUEL pour votre information et votre usage personnel ; il ne peut être vendu, concédé sous licence ni partagé sur d’autres sites sans l’accord de son auteur.Le contenu vous est fourni TEL QUEL, pour votre information et votre usage personnel uniquement. Téléchargez la présentation en cliquant sur ce lien. Lors du téléchargement, si vous ne parvenez pas à télécharger une présentation, l’éditeur a peut-être supprimé le fichier de son serveur.Pendant le téléchargement, si vous ne parvenez pas à obtenir une présentation, le fichier a peut-être été supprimé par l’éditeur.

F I N

Plus de contenu associé

Transcription de la présentation
  1. ELT Stellar Populations Science • Near IR photometry and spectroscopy of resolved stars in nearby galaxies provides a way to extract their entire star formation and chemical enrichment histories • Crowding is the limiting factor for photometry of bulges, disks, and the main bodies of elliptical galaxies; sensitivity will be limiting factor for regions with lower surface brightness • (independent of aperture size) M31 observed with Gemini N+NIRI/Altair (Olsen et al. 2006) KHB~23.5

  2. Issues addressed through simulations Scientific Issues: Sample size needed Field size needed Filters needed Photometric Issues: Spatial variability of PSF Time variability of PSF Absolute calibration

  3. PSF Simulation • AO Error sources included • Finite number of guide stars and DMs • Finite spatial resolution of wavefront sensors and DMs • Sampled on 7x7 20” wide grid in IJHK for 20-m, 30-m, 50-m, and 100-m telescopes • Sampled over 12-minute average intervals from hour-long “typical” observation with TMT MASS/DIMM • 5 atmospheric profiles  4 filters  49 positions  4 telescopes = 3920 PSFs

  4. 30-m J PSF grid, profile 1 Simulating a realistic observation Courtesy of Richard Clare

  5. Simulation procedure • Select appropriate population mix • Pick stars from stellar isochrones and place in image, making sure to simulate stars well below crowding limit • Convolve image with PSFs (495 convolutions, combine through weighted average) • Add sky background and noise • Perform PSF-fitting photometry • Correct photometry for Strehl ratio using profile 1 or average of profiles 1 and 5 • Derive best-fit population mix

  6. “Raw” photometry With 1 PSF observation With 2 PSF observations “Perfect” photometry 20-m to 100-m: M31 Bulge KHB~23.5, KMSTO~27

  7. 20-m to 100-m: M31 Bulge 20-m 30-m 50-m 100-m

  8. An M31 Survey: 20-m Name r() SK B/D Klim Time(s) F1 1.97 15.0 7.4 24.1 21.8 Bulge1 2.05 15.1 6.7 24.1 24.9 F177 2.79 15.4 5.5 24.4 38.3 F174 2.59 15.4 5.3 24.4 38.3 F3 3.80 15.8 3.8 24.7 66.9 Bulge2 3.83 16.0 3.1 24.9 87.8 F4 3.98 16.1 2.7 25.0 100 F5 5.84 16.4 2.0 25.2 147 F170 6.08 16.5 1.9 25.3 168 Disk2 9.09 17.1 1.1 25.7 348 F2 11.9 17.8 0.3 26.1 776 F280 20.5 18.4 0.2 26.6 1767 Disk1 56.9 19.6 0.0 27.8 17476 1 hour exposure, S/N=5: J: 28.9 H: 28.0 K: 27.0 KHB~23.5, KMSTO~27 Local Group Survey (Massey et al. 2002) image