CDS Business Mapping
The Risk Meter Online™ provides an advanced platform for evaluating property flood risks with a focus on geographical elevation factors. This tool performs detailed property risk reports that are quick and user-friendly, leveraging GIS technology. It not only checks individual risks but can also assess entire portfolios for geographic hazards such as flooding, brush fire proximity, and more. Key insights include elevation above flood zones, estimated base flood elevation (eBFE), and the implications of FEMA maps, highlighting that many flood claims originate outside the recognized floodplain.

CDS Business Mapping
E N D
Presentation Transcript
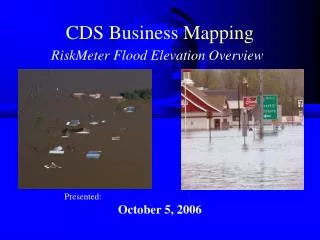
CDS Business Mapping RiskMeter Flood Elevation Overview Presented: October 5, 2006
The Risk Meter Online™ • Performs property risk reports • Quick, accurate, easy-to-use • Check individual risks or an entire book for geographic risks (Batch) • Uses GIS (mapping) technology • The right technology for the problem
The Risk Meter Online • Distance to Shore • Flood Zone Determinations (First American) • Proximity to Brush Fire Hazards (All Western States) • MMI, Soil, EQ Scores • Crime Scores • State Windpool Eligibility • State Tax Codes • Sinkholes • FL Windspeed Credit Maps • Hail Exposure Index • Tornado Exposure Index • Rating Territory (Your territories) • Slope, Aspect, Elevation • Aerial Photos • And More!!!
Key Flood Issues • Flood risk does not end at the edge of the zone • FEMA maps are modeled • Changes to the surface topology and coverings affect drainage and flooding • It has been estimated that ¼ of all flood claims occur outside of the 100 year flood plain • Companies writing non-NFIP flood should be concerned with risks beyond the 100 year flood plain
Standard Flood Map • Shown from above • For NFIP business, everyone simply checks to see if the property falls “within a flood zone” • No easy way to estimate risk outside of the 100 year flood zones Red-In the 100 year flood plain Green-Outside the 100 year flood plain
The Ideas behind the new report • Let people know when they are at risk and not in a flood zone • Use elevation as the secret weapon • Estimate this risk by returning • Proximity to the flood zone • Estimated height above the flood zone
A Comparison Overhead View Profile View
This is a House in a Flood Plain The location falls within the extents of the flood plain
This is a Flooded House in a Flood Plain Base Flood Elevation (BFE) is the elevation of the surface of the water when flooded to the 100-year flood level
Is this House at Risk? This house is not in a flood zone, but it is very close
What if the FEMA Maps are Wrong? -FEMA Maps are modeled -Floods are often worse than predicted by FEMA -25% of all flood losses occur outside of 100 year flood zones
Concept behind new Report Make better decisions about properties close to 100 year flood zones
Information Returned • Standard fields in RiskMeter flood reports, plus: • FEMA Flood Zone • Distance to nearest flood zone (A or V) • Elevation • Estimated Base Flood Elevation (eBFE) • Estimated height above flood zone • In a Flood Zone, estimated water depth
Benefits • Excess Flood Providers • Better evaluate risks that are near flood zones • Recognize the risk, even though the property is located outside of the flood zone • Agents/Companies selling flood insurance • Let people know that they are very close to a flood zone • Explain the risk, and how inexpensive flood coverage will be • Sell more flood insurance • Valid for both NFIP and non-NFIP business
Future Enhancements • Storm surge modeling will be added • Identifying areas protected by levees • Better elevation shading • Overlay risk layers on aerial photos
Questions? Dan Munson Vice President of Sales & Marketing CDS Business Mapping 67 Broad St. – 6th Floor Boston, MA 02109 617-737-4444 dmunson@cdsys.com www.riskmeter.com