Download
1 / 49
500 likes | 959 Vues
How to conduct a Social Network Analysis: a tool for empowering teams and work groups. Jeromy Anglim Department of Psychology, The University of Melbourne Lea Waters Department of Management, The University of melbourne. Correspondence: Jeromy Anglim Email: jkanglim@unimelb.edu.au

E N D
How to conduct a Social Network Analysis: a tool for empowering teams and work groups Jeromy Anglim Department of Psychology, The University of Melbourne Lea Waters Department of Management, The University of melbourne Correspondence: Jeromy Anglim Email: jkanglim@unimelb.edu.au For a copy of the presentation: Just email me
Why are you here • What do you want to get out of this conference? Why are you here? • What is your I/O psych social network now? • What do you want it to look like at the end of the conference? • What role do social networks play in making this conference a positive experience?
Clichés or Truisms? • “It’s a small world in I/O Psych” • “It’s not what you know; it’s who you know” • “Business is built on relationships” • “We’re living in a networked world”
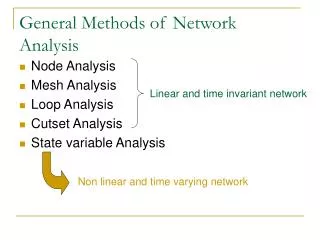
Overview • Overview of Social Network Analysis • Some classic examples • Terminology of Social Network Analysis • Consulting Model • Nuts and bolts • Questionnaire design • Software • Results presentation • Concluding Thoughts
What is social network analysis? • What is Social Network Analysis? • Set of mathematical, graphical and theoretical tools for modelling networks and the structures therein • A lens for understanding the social world in a relational way • What social networks are you a part of?
Multiplicity of networks • Official versus Unofficial • Examples • Advice: • “Who do you go to for advice?” • “Who goes to you for advice?” • Collaboration • “Who do you collaborate with?” • Trust • Who do you trust? • Friendship • Who is your friend? • Conflict
Relevance to I/O • Classic constructs • Job Satisfaction & Motivation • Job Performance • Leadership & Power • Organisational Culture & Climate • Job Search, Career Development, Mentoring What happens when we view these through the lens of social network analysis
Playing Kevin Bacon What’s the Kevin Bacon number of John Travolta? Or in social networks language: What is the shortest path (geodesic) between John Travolta and Kevin Bacon? • John Travolta • 1. John Lafayette • 2. Kevin Bacon • Kevin Bacon Number = 2 http://oracleofbacon.org/cgi-bin/oracle/movielinks?firstname=Bacon%2C+Kevin&game=1&secondname=John+Travolta
Social Networks – Key Terms • Actor/Node • Tie/Link/Relationship • Attribute • Network • Relationship properties • Type of Relationship (e.g., friendship, advice) • Direction of Relationship (directed vs undirected) • Strength of Relationship (binary vs weighted) • Whole Network Properties • Centralisation • Density • Size
Social Networks – Key Terms • Node Network Properties • Isolate (no ties) • Outlier (one tie) • Structural Hole & Brokers • Degree • Centrality • Tie Properties • Reciprocity • Bridge • Geodesic (shortest distance) • Clique
Study of the Medici Family Portrait of Medici Family Source: Wikipedia • Rise of the Medici family in medieval Florence • How did the family achieve such influence? • What does this case study tell us about the role of network position and network structure on power relationships?
Actors: Florentine Families (size = 16 families) • Ties: Undirected unweighted marriage tie • Density: 16.7% of possible ties present Marriage Network Isolate Central Actor Broker Degree = 6 Clique Outliers Degree = 1 Breiger & Pattison (1986); Padgett & Ansell (1993)
Florence • Which families are central in both networks? • Which families do you think might have more power? Marriage Network Business Network
Key players (Cross & Prusak, 2002) • Boundary spanners • Central connectors • Information brokers • Peripheral specialists
Dynamic network processes • Changing Node Attributes • Changing network characteristics • Adding or removing actors • Adding or removing relationships • Examples • Gossip, ideas, innovation, Attitudes • Related to the theory of Memes
Applications • Consultants and HR workers • Employee Opinion Surveys • Culture Change • Team development • Personal development
2. Consulting Model Team Consulting
Social Networks in the Team Context • Internal Team Networks • External Team Networks
Basic Team Theory • Team vs Group • Interdependence • Pooled, Sequential, Reciprocal • Team Performance • = Individual Performance + Process Gain – Process Loss • Tuckman’s Stage Model • Forming > Storming > Norming > Performing > Adjourning • Gersick’s Punctuated Equilibrium Model • Input – Process – Output Model • Team Mental Models (Task & Team)
Consulting Model • Feedback & Awareness • “If it’s not measured, it doesn’t matter” • Model vs previously conceived network • Model vs Ideal network
3. Nuts & Bolts Questionnaire design Software Results presentation
Questionnaire design • Network Questions • Choice of response scales • Pragmatics
Example Response Scale • Response scale • 0) Never; • (1) Less than once a month; • (2) Once or twice a month; • (3) Once or twice a week; • (4) About once a day; • (5) 2 or 3 times a day; • (6) 4 or more times a day.
Which networks do we model?Example Questions • Advice • How often do you give this person advice? • How often are you given advice by this person? • Information Sharing • How often do you share information with this person? • How often does this person share information with you? • Other networks • Consultation • Discuss challenging technical matters • Turn to the person to resolve conflict • Motivate • Help, Remind & Clarify Team Goals
Designing a Social Networks Questionnaire • Lessons learnt • Ask questions in both directions • General principles of questionnaire design still apply • Match response scale and questions to purpose
Storing The Data • Different methods: • Matrix • List of ties • All possible ties • Decision • Depends on software • Proposed analyses
Simple Analyses • Feeding back the raw data • Summary Statistics • Visual Representations
Tables of Values Overall Mean = 3.7 • Who reports sharing the most? • Who do other share the most with? • What’s the overall level of sharing?
Tables of Values Overall Mean = 3.7 Overall Mean = 3.5
Multidimensional Scaling • Who’s in the centre? • Who’s close? • Who’s distant? • Any spatial cliques? • What does the general configuration suggest? • Using SPSS Proxscal • 2000 multiple random starts • Ordinal transformation untied • 2 dimensions
Reciprocity • Directed network minus transpose of directed network • Provides Discussion Points • What’s going on with Cat and Eve? E.g., 3 – 0 = -3
Reciprocity Who thinks they share more information with others, than others report sharing with them? OR The I-Give-but-don’t-Get Index
I Share Info Shared view • Network 1 (I share with you) minus transpose (you share with me) • To what extent do team members see the same relationships the same way They Share Info Shared View E.g., 3 – 5 = -2
Shared view Who thinks they share more than others think they share? OR The I’m great, but others don’t see it Index…
4. Concluding Thoughts Challenges Lessons Learnt What’s next?
Challenges • Clarity of communication • Educating about social networks analysis • Confidentiality Concerns • Missing Data
Lessons Learnt • Active process of interpretation • Critical to know the team in order to interpret the diagram • Test the meaning with the actors • Get involvement • Plan ahead & refine tools
The next step • Understanding • How can social network analysis be made more intuitive? • Actionable Recommendations • How can descriptive social network analysis be better converted into actionable recommendations? • Relevance • What situations could you apply social network analysis?
Happy Networking Good food.. Good wine… Good conversation… Questions? Correspondence: Jeromy Anglim Email: jkanglim@unimelb.edu.au For a copy of the presentation: Just email me
Social Networks Analysis • Example Software • Netdraw (free software for drawing social networks) • UCINet (30 day trial; provides information about properties of social networks) • Important Journals • Social Networks • Websites • http://www.humax.net/teams.html (easy introduction into networks as applied to teams) • Book • Wasserman, S., & Faust, K. (1994). Social Networks Analysis: Methods and Applications. United Kingdom: Cambridge University Press. • Example Datasets • http://vlado.fmf.uni-lj.si/pub/networks/data/UciNet/UciData.htm • The University of Melbourne, Department of Psychology • Major centre for social networks research: Pip Pattison, Garry Robins
Readings • Baker, 1995 www.humax.net/teams.html • Cross, R., & Prusak, L. (2002). The people who make organisations go – or stop. Harvard Business Review, 104-112