Download
1 / 21
210 likes | 426 Vues
Managing Fuel Price Risk June 2001. Juan Colás Latin America & Caribbean Commodities Head 1-(212) 723.6979 juan.colas@citi.com. Overview. I . Fuel Volatility II. Why Hedge ? III. Proposed strategies IV. Case Study : U.S. Airlines V. Summary.

E N D
Managing Fuel Price RiskJune 2001 Juan Colás Latin America & Caribbean Commodities Head 1-(212) 723.6979 juan.colas@citi.com 1
Overview • I. Fuel Volatility • II. Why Hedge ? • III. Proposed strategies • IV. Case Study : U.S. Airlines • V. Summary 2
Fuel # 2 Historical Prices(U.S. $ Cents/ Gallon ) Pr 95 90 85 80 75 70 65 60 55 50 45 40 35 30 Jan89 Jul Jan90 Jul Jan91 Jul Jan92 Jul Jan93 Jul Jan94 Jul Jan95 Jul Jan96 Jul Jan97 Jul Jan98 Jul Jan99 Jul Jan00 Jul Jan01 Jul 3
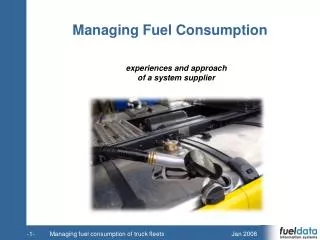
How Does Fuel Volatility affect Utilities • Utility companies consume large volumes of Fuel #2 • The Volatility in Fuel # 2 prices is passed directly to the electricity prices in the different countries . 5
How Does Fuel Volatility affect Utilities • Volatile Electricity Prices have a negative impact in the local economies: • Uncertainty in budgeting energy expenses for industries • Lack of competitiveness internationally • Slowdown in economic activity . 6
II- Why Hedge ? • Fuel # 2 price historical annual volatility for the last ten years has been 27 %. Last year’s volatility was 45 % • Assuming a 1 yr forward Price of $0.7350 / Gal , and using the last 10 yrs historical volatility, the average Fuel price for the next twelve months could vary from 0.34 to 1.13 with a 95 % confidence interval. 7
II- Why Hedge ? • Under this assumption, fuel costs for next twelve months can fluctuate on average 45 cents per gallon consumed . For 100 MM Gallons consumed, the cost can fluctuate US 45 Million 8
II.- Why Hedge? Jet Fuel Cost Probability Distribution Probability No hedge Hedge 50% with swaps Fuel Cost 94. MM :100 MM * 0.94 49 MM 100 MM * 0.49 61.3 MM 83.60 MM 9
Proposed Strategies :1: Fixed Rate Fuel Oil Swap Utility Co. Fuel Provider Floating Fuel Price Protected Electricity Price PHYSICAL CONTRACT Fuel # 2 FloatingPrice US$ 0.6850 DERIVATIVES CONTRACT Local Customer 10
Option # 1: Extendible Swap • Tenor : 1 Yr. Extendable into another year • Fixed Price : US$0.6850 / Gallon • Floating Price : Daily Average of Fuel # 2 Price as reflected in Platt’s • Notional : To be defined • Utility’s Fuel Cost of the portion hedged will be US$0.6850 per gallon, independently of the Floating Price 11
Option # 1: Extendible Swap • Each month, if the Floating Price is above US$0.6850, Citibank will pay the difference to Utility. • If the price of fuel falls below US$0.6850 , Utility will pay the difference to Citibank. • The Contract with the Fuel Provider does not change. Utility will remain paying the Floating Price, which should be the same as the Floating Price received in the swap. 12
Option # 1: Extendible Swap • To obtain this price, Utility will grant Citibank the right to extend the Swap another year. Citibank will decide, on June02, whether or not to exercise this option based on market conditions at that time. • If at the end of June 02 the one year swap is lower than US$0.6850 / Gal. Citibank will extend the swap one more year. • If the swap price is above US$0.6850 / Gal, Citibank will not extend the swap. 13
Proposed Strategies :2: Extendible Zero Cost Collar Utility Co. Fuel Provider Floating Fuel Price Protected Electricity Price PHYSICAL CONTRACT Fuel # 2 FloatingPrice DERIVATIVES CONTRACT Floating price with Cap at 0.75 and Floor at 0.65 Local Customer 14
Option #2: Zero Cost Collar • Utility final Fuel Cost of the portion hedged will be within the US$0.75 / Gal -US$ 0.65 / Gal range • If the Floating Price is above US$0.75, Citibank will pay the difference to Utility. • If the price of fuel falls below US$0.65 , Utility will pay the difference to Citibank. • If the price remains within the 0.75-0.65 range, there will be no liquidations. 15
Option #2: Zero Cost Collar • The Contract with the Fuel Provider does not change. Utility will remain paying the Floating Price • To obtain this price today Utility will grant Citibank the right to extend the same Collar another year. Citibank will decide, on June 02, whether or not to exercise this option based on market conditions at that time. 16
Case Study : U. S. Airlines • Airlines are large consumers of Jet Fuel. Fuel costs represent around 15 % of Total Costs • Fuel Price Volatility cannot be passed entirely to the consumer • All U.S. Airlines describe their Hedging Policy in their annual report. All of them hedge at least a portion of their portfolio. • Most Latin American and Caribbean Airlines also hedge part of their Fuel consumption • Airlines that show less volatile results are rewarded by the market by trading at a higher P/E ratio. 17
Case Study : U.S. Airlines Establishing a Hedging Policy • Keep a percentage of annual consumption always hedged ( 30 % - 50 % ) • Allow for a minimum level of Price participation ( Not as relevant to Utilities as to other industries ) • Hedging is a Policy Management decision ( not an opportunistic individual decision ) • Constant Monitoring and Evaluation IT MUST PROTECT AGAINST PRICE SPIKES AND REDUCE VOLATILITY 18
Summary • Companies in different industries use derivatives to reduce their exposure to Fuel Price Volatility. • Caribbean Utilities are largely exposed to Fuel # 2 prices. • Caribbean Utilities can offer more stable electricity prices to their consumers by reducing their exposure to Fuel Prices by using derivatives. • Citibank will be delighted to assist you designing the most adequate hedging policy for your company 20
Contacts at Citibank • Fabian Keil, Mitch De Silva • Citibank Trinidad & Tobago Limited • 12 Queen’s Park East • Port of Spain • Trinidad • 1-868-625-9130, 1-868-625-1046/9 • fabian.keil@citicorp.com • mitchell.desilva1@citicorp.com 21