Comparative Light Response Curves for ETR in Accessions of D4, D3, and T2 Plant Species
20 likes | 119 Vues
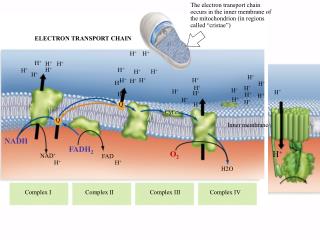
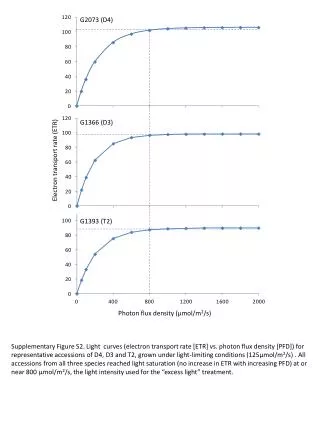
This figure shows light curves of electron transport rate (ETR) versus photon flux density (PFD) for representative accessions of D4, D3, and T2 plants grown under light-limiting conditions (125 μmol/m2/s). All accessions reached light saturation at or near 800 μmol/m2/s, the intensity used for excess light treatment.

Comparative Light Response Curves for ETR in Accessions of D4, D3, and T2 Plant Species
E N D
Presentation Transcript
G2073 (D4) G1366 (D3) Electron transport rate (ETR) G1393 (T2) Photon flux density (μmol/m2/s) Supplementary Figure S2. Light curves (electron transport rate [ETR] vs. photon flux density [PFD]) for representative accessions of D4, D3 and T2, grown under light-limiting conditions (125μmol/m2/s) . All accessions from all three species reached light saturation (no increase in ETR with increasing PFD) at or near 800μmol/m2/s, the light intensity used for the “excess light” treatment.