SECOORA Geo Tools Presentation
270 likes | 405 Vues
SECOORA Geo Tools Presentation. Dan Ramage, University of South Carolina dan@inlet.geol.sc.edu. Outline. Aggregation Storage Discovery Distribution Near Future Development. Project Context. SECOORA Southeast Coastal Ocean Observing Regional Association

SECOORA Geo Tools Presentation
E N D
Presentation Transcript
SECOORAGeo Tools Presentation Dan Ramage, University of South Carolina dan@inlet.geol.sc.edu
Outline • Aggregation • Storage • Discovery • Distribution • Near Future Development
Project Context SECOORA Southeast Coastal Ocean Observing Regional Association “SECOORA is to be designed and operated to provide data, information and products on marine and estuarine systems. Information will be provided to users in a common manner and according to sound scientific practice. SECOORA will include the infrastructure and expertise required for this system. “
Data Aggregation • In-situ observations are collected from a variety of sources, such as buoys, water level stations, pier based meteorological stations, etc. in a near-real time manner. This data is then converted into multiple formats such as netCDF and/or obsKML for insertion into a relational database(RDB). • From this database of recent observations a variety of file formats, web services and applications can be driven. By suggesting a minimally common observation oriented XML and RDB schema, developed scripts and products can benefit from and build around these shared schema.
Data Providers 1. In-situ observations (buoy, water level station, etc) 2. Model output (elevation, currents, particle trajectories, etc) 3. Screen-scraping (NDBC, NWS,USGS,etc) or file translation 4. netCDF files (Regional convention format and data dictionary) Data Aggregation 5. Data Scout: Polls data providers for new in-situ, model data. Implements region specific output formats for importation by database. A fully relational schema, Xenia. 6. Relational Database (Postgres or SQLite) Data Flow
Data Aggregation • Who are some of the providers? • National Backbone • NWS • USGS • NDBC • NOS • NERRS • Regional Providers • University of South Carolina • University of North Carolina • University of South Florida • Skidaway Institute of Oceanography
Base environment Linux Apache Plone Perl & PHP Python Mapping & imaging MapServer(gdal,ogr) OpenLayers TileCache Gnuplot Technologies Employed • Data storage • PostgreSQL • PostGIS • SQLite • SpatiaLite, spatial enablement for SQLite • obsKML, Google KML based • Filesystem
Why Open Source? • Pros • Most software either free or quite inexpensive • Common data sharing standards • OGC, WMS, WFS, SOS • Google KML • Large developer community • Wikis, Bulletin Boards, Listservs • Cons • Documentation and packaging can be lacking • Large developer community working on array of different operating systems
Data Parsing • Data Scout • Discovers and processes the netCDF files and outputs either SQL statements or obsKML to be read into the database. • Screen Scraping • Pull the data directly from columnar data from a providers website.
Data Storage, the How’s • The Xenia Schema • Recent near real-time in-situ observations are aggregated to a ‘Xenia’ schema relational database(RDB) • The schema was developed to provide a good general purpose relational database, focused on in-situ observation data. • SQLite Database Engine • SQLite is a software library that implements a self-contained, serverless, zero-configuration, transactional SQL database engine. • SpatiaLite is a library that allows processing of GIS and spatial data in SQLite databases.
Xenia Relational Database Schema Hierarchy = organization->platform->sensor->multi_obs(observation data)
Data Storage, the Why’s • The focus of the database is on individual measurements, not platforms. Previous schemas were platform centric, Xenia addresses most of the shortcomings of that design, such as slow multi-platform queries since the design called for a table per platform schema. • Bridging the gap between raw data collection and the organization and sharing of data using previously developed products, services and standards(leveraging earlier work against new data providers) • Fostering a standardization of products and services via a common openly shared technical infrastructure(common database schema and product support scripts) • The SQLite implementation of Xenia is designed for low-volume data(< 100,000 records per hour) in-situ observational platforms or system arrays (e.g. 1 to 1000 platforms collecting 10-20 observations per hour) collecting data at any geographic scale (local,regional,national,etc) • SQLite implements the database as a single file. This makes it simple to distribute the database for users who want to implement their own data mining.
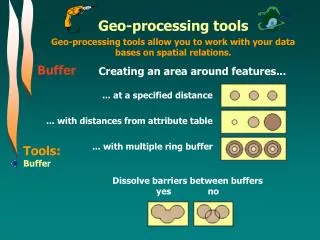
Data, you can have it your way • Data is available in a number of different file formats as well as web-services. In addition to having all the in-situ data available, per observation access is provided also. • File formats: • CSV • Shapefile • obsKML • Styled KML • SQLite database • Web Services: • WMS • WFS • SOS • GeoRSS
Data *CSV files *Query&Download *KML Graphs *Time series *Depth profile Maps *GIS *Animations QC&Notification *Missing data *Range Data Sharing *OGC SWE/SOS services (SensorML, O&M) Graphs *Time series *Depth profile *TBD by users Maps *OGC Web Mapping Service (WMS) QC&Notification *Missing data *Range *Continuity Products and Services from Aggregated Data Aggregated Data 6. Relational Database (Postgres or SQLite) Data Products Data Access/Web Services
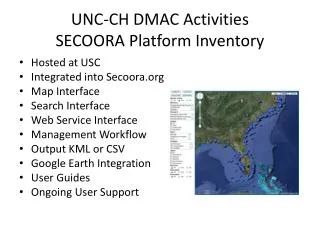
Applications - SECOORA interactive map Latest regional observation maps are accessed via WMS(Web Mapping Service) and merged into an OpenLayers(browser javascript) map interface. Observation database requests are supported via WMS GFI(Get Feature Info) http://secoora.org/maps/dynamic
Applications - CarolinasRCOOS Map image layers supported via MapServer WMS with increased map response time via TileCache which tiles and caches image requests for repeated reference. Site feature info supported via Xenia database instance styled output html table accessed via WMS GFI. http://carolinasrcoos.org
Applications – National Weather Service Latest regional platform observations from Xenia database are styled to html tables and presented in fixed map interface alongside NWS forecast warnings/advisories and other map layers of interest http://forecast.weather.gov/mwp/
Data Distribution – ObsKML ObsKML (Observations KML) A simple XML encoding of observation metadata associated with a KML Placemark. Default XML import/export format for Xenia database Instances. Postgres or Sqlite database paths
KML/KMZ – Latest obs by platform KML (Keyhole Markup Language) which is the XML format used to visualize data in Google Earth/Maps and potentially other globes/maps with KML support such as NASA WorldWind and ESRI ArcExplorer. OGC Standard. Can be imported by other GIS platforms, such as OpenLayers. Latest observation data organized by all observations per platform http://tinyurl.com/664wtx
KML/KMZ – latest obs by obsType • All observations carry: • Observation type(obsType) • Unit of measure(uom) • Measurement value • Color Styled low to high value blue/green/red http://tinyurl.com/664wtx
GeoRSS • GeoRSS allows users to subscribe and have the data they are interested in “pushed” to them via an RSS reader. • Simple, lightweight XML format.
Near Future Steps • Virtualization • What is it? • In general terms, it is the abstraction of computer resources. • For our purposes, it is the separation of the operating system from the underlying computer resources. • What does that mean to me? • This type of architecture is (ideally) more reproducible, scalable, redundant, and portable • Instead of owning and maintaining server hardware, images can be hosted in the “Cloud” while requiring less internal system maintenance or housing costs • What do I need? • We’re using free software from VMWare, called the VMPlayer, that “plays” the image. http://www.vmware.com/
Near Future Steps • QA/QC • Implementation of more comprehensive quality checks. • Application Development • Implement user-defined services or data delivery methods • Documentation • Process documentation to make it easier for others to clone what we’ve done.
Credits 2C.Calloway,2J.Cleary,1J.Cothran,4J.Donovan, 3J.Dorton,1M.Fletcher,C.Galvarino,1S.King, 2S.Haines,3L.Leonard,1D.Porter,3X.Qi, 1D.Ramage,2H.Seim,4V.Subramanian,1S.Walker,4R.Weisberg 1University of South Carolina, 2University of North Carolina at Chapel Hill, 3University of North Carolina at Wilmington, 4University of South Florida
SECOORAGeo Tools Presentation Dan Ramage, University of South Carolina dan@inlet.geol.sc.edu